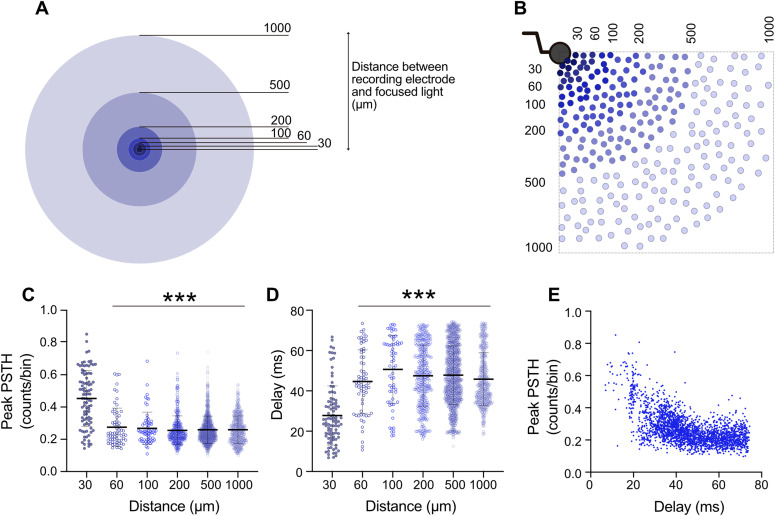
Figure 4. Distance-dependent direct and indirect responses to holographic stimulation.
(A) Categorization of distances between each holographically stimulated neuron and each of the six analyzed electrodes was based on their radial distances from the edge of the electrode. (B) Sample schematic depicting distribution of stimulation points (ChR2-EYFP–expressing neurons) in relation to an electrode. (C, D) For each target neuron, 20 pulses were applied (450 nm, 50 ms, 2 Hz) and PSTHs were measured at six active electrodes. PSTH peak value and measured delay from stimulus onset were extracted and plotted based on categorized distances. The number of PSTHs studied at distances of 30, 60, 100, 200, 500, and 1,000 μm was 105, 67, 65, 379, 1,276, and 880, respectively. (C, D) Each dot represents a PSTH peak value (C) or peak position (D) for individual stimulation episodes. Average values represented as mean ± SEM with thick horizontal lines and vertical error bars. Mixed-effect analysis followed by Sidak’s multiple comparisons test was applied to compare between different distances. ***P < 0.001 versus the mean value at 30 μm distance. (E) Correspondence between individual PSTH peak values (amplitude) and PSTH peak positions (delay). Data were collected from recordings from one multi-electrode array, 35–80 days post induction.

