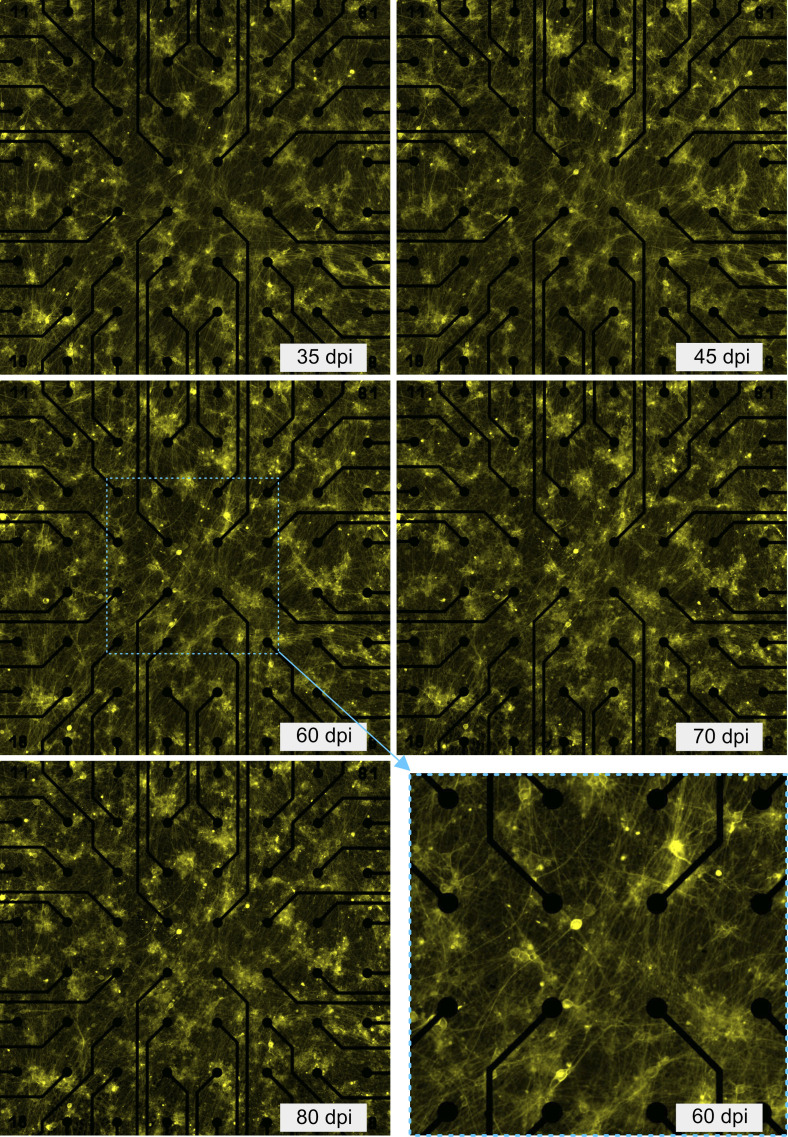
Figure S1. Network morphology at different days post induction.
Fluorescent microscopy images (20 high-resolution microscopy images (20× magnification)) were stitched. Bottom right panel shows the magnified view of the network area covering 16 electrodes. These images were used for identifying the position of each neuron for holographic stimulation. Distance between electrodes, 200 μm, electrode diameter, 30 μm.

