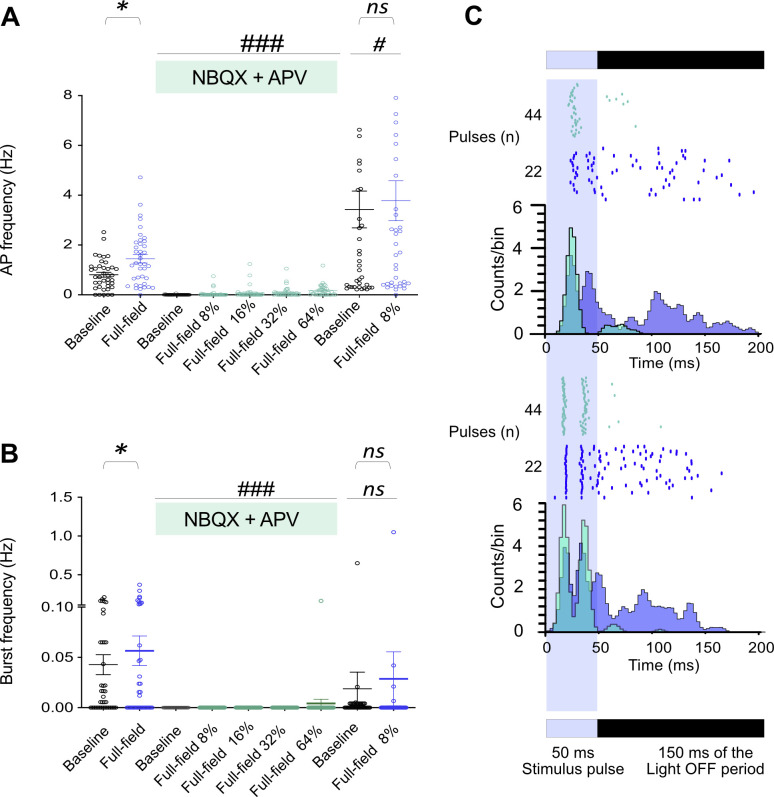
Figure S4. Effect of AMPA and NMDA receptor antagonists on network activity features at baseline and optically stimulated (full-field) conditions at 110 days post induction.
Signal profiles for different conditions are shown in Fig S5. Light stimuli (470 nm, 50 ms pulses at 0.5 Hz) with different intensities from 8% (0.46 mW/mm2) to 64% (2.74 mW/mm2) were applied. (A, B) Action potential frequency and burst frequency averaged across active electrodes of two multi-electrode arrays in active electrodes under different conditions. Each circle represents one electrode, and thick lines represent the average activity under specific conditions. Baseline spontaneous activity and responses by optical stimulation (full-field) before or after NBQX+APV treatment were analyzed using the nonparametric Wilcoxon matched-pairs signed rank test (*P < 0.05 versus Baseline). The average responses to the full-field stimulation in the presence of NBQX+APV are compared with baseline or full-field stimulation before treatment using the nonparametric Friedman test, followed by Dunn’s multiple comparisons test (#P < 0.0, ###P < 0.001 versus baseline or full-field stimulation before treatment). (C) PSTH calculated 200 ms from stimulus timestamps in 3 ms bins in two electrodes (upper and lower graphs) in untreated (blue) and NBQX+APV treated (green) conditions. In each graph, the upper panel with raster plots shows the individual responses for 44 pulses or 22 pulses (arranged from bottom to top) in NBQX+APV treated (green) and untreated (blue) conditions, respectively. The resulting histogram has been plotted based on cumulative counts per bin. PSTH with higher peak amplitude during the light pulse is followed by delayed low amplitude histograms. These low amplitude histograms were vanished in presence of NBQX-APV.

