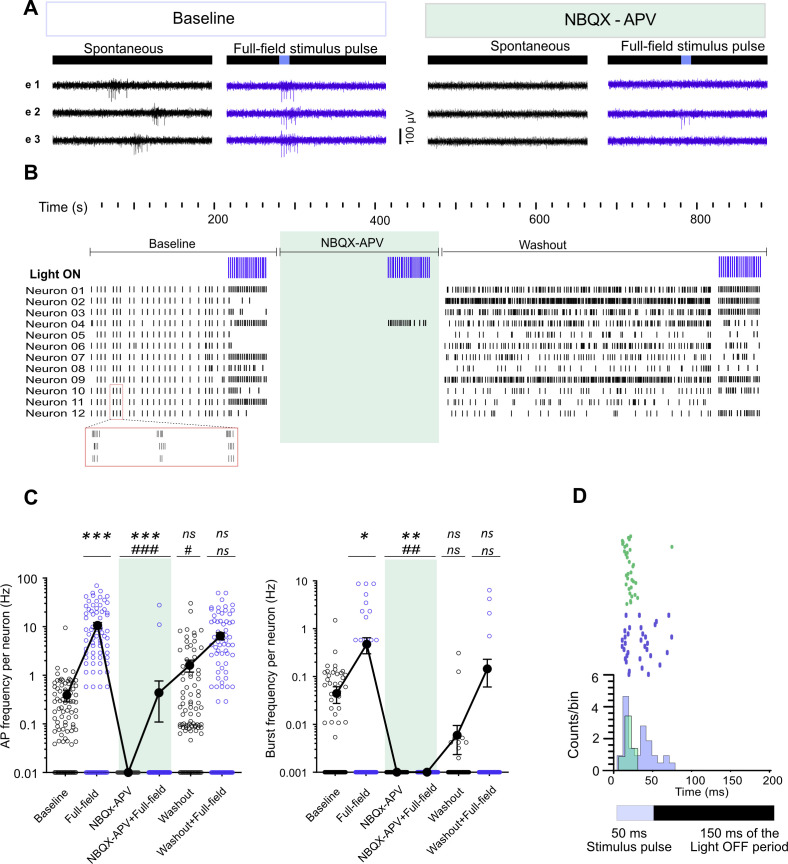
Figure S5. Effect of AMPA and NMDA receptor antagonists on sorted neurons activity features under baseline and optically stimulated (full-field) conditions at 110 days post induction.
(A) Signal profiles for different conditions are shown in three electrodes of one culture. Light stimuli (470 nm, 50 ms pulses at 0.5 Hz) with 8% intensity (0.46 mW/mm2) were applied. (B) Raster plot of activity in different experimental conditions (Baseline, NBQX-APV treated, and washout, 12 neurons are shown). Applied episodes of full-field stimulation in each condition are shown in the first row (Light ON, n = 22 pulses per episode). A magnified view of three synchronized burst activity events at baseline is highlighted by a red rectangle below the raster plot. Spontaneous activity was synchronized across all detected neurons. (C) Average action potential frequency and burst frequency of 92 neurons in two multi-electrode arrays. Each circle represents one neuron. Filled circles (black) represent the average activity under each condition. Baseline spontaneous activity and responses to optical stimulation (full-field) before or after NBQX+APV treatment were analyzed using the nonparametric Wilcoxon matched-pairs signed rank test (*P < 0.05 versus Baseline). The average responses to the full-field stimulation in the presence of NBQX+APV were compared with baseline or full-field stimulation before treatment using the nonparametric Friedman test, followed by Dunn’s multiple comparisons test (#P < 0.05, ##P < 0.01, and ###P < 0.001 versus baseline or full-field stimulation before treatment). (D) PSTH calculated 200 ms from stimulus timestamp in 3 ms bins of one neuron in untreated (blue) and NBQX+APV treated (green) conditions. Raster plots show the individual responses of the neuron for 44 pulses or 22 pulses (arranged from bottom to top) in NBQX+APV treated (green) and untreated (blue) conditions, respectively. The resulting histogram has been plotted based on cumulative counts per bin.

