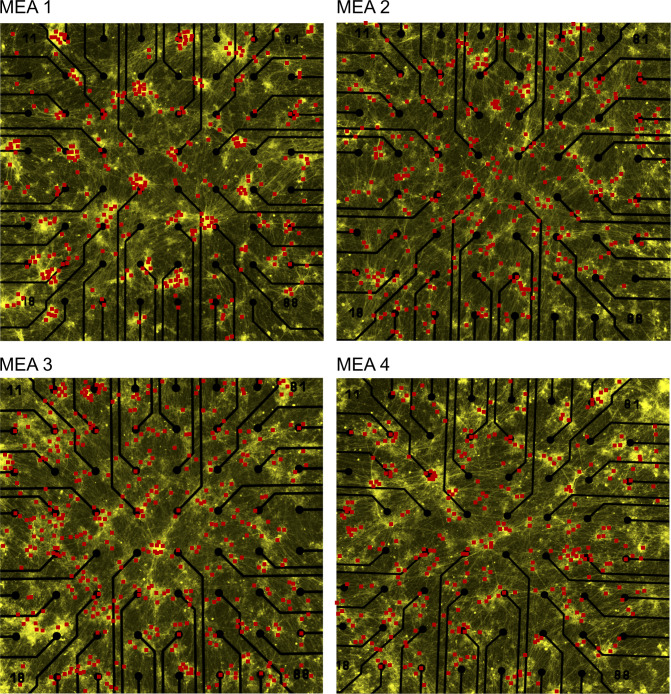
Figure S7. Holographic stimulation coordinates in four different multi-electrode arrays at 60 days post induction.
Each red dot indicates a selected ChR2-EYFP–expressing neuron that has been stimulated by one episode of holographic stimulation (20 pulses, 450 nm, 50 ms, 2 Hz). Total number of applied holographic stimulation episodes varied between multi-electrode arrays depending on the total number of detected neurons. All neurons were manually selected then their position was saved automatically. A custom developed software interface selected neurons one by one for stimulation. The order of neuronal stimulation was based on order of manual selection. Electrode pitch is 200 μm.

