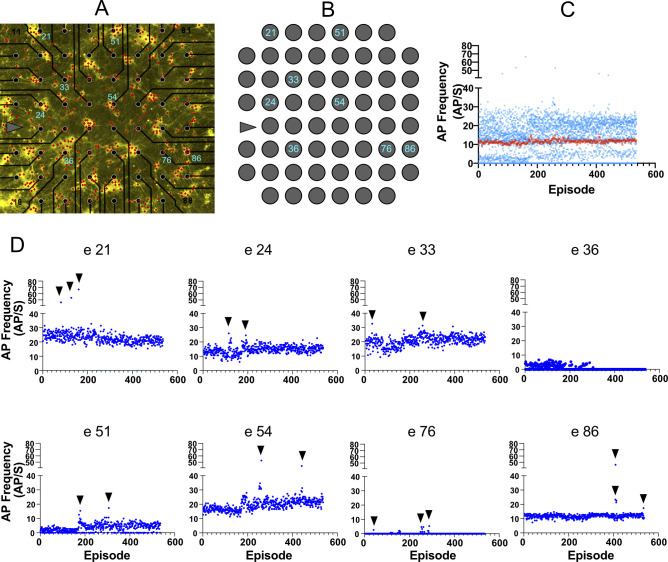
Figure S8. Tracking the activity during subsequent episodes of holographic stimulation.
(A) Network on multi-electrode array with 536 selected neurons (red dots) at 35 days post induction. (B) Position of the electrodes of interest in the network. (C, D) Average activity in each holographic episode calculated (blue dots) and plotted based on episode number (episode 1–536). Each episode included 20 pulses of holographic stimulation applied to the same neuron. Each electrode showed high-amplitude direct responses to a few episodes that targeted particular neurons in the network (indicated by black arrows). (C) Average response of all electrodes (C) did not change during 536 subsequent holographic stimulations (red squares). Each blue dot represents the average response of each electrode to a specific episode. The first 500 episodes of holographic stimulation data of electrode 21 have been shown in Fig 3I to compare them with AP frequencies evoked by full-field stimulation. Distance between electrodes is 200 μm.

