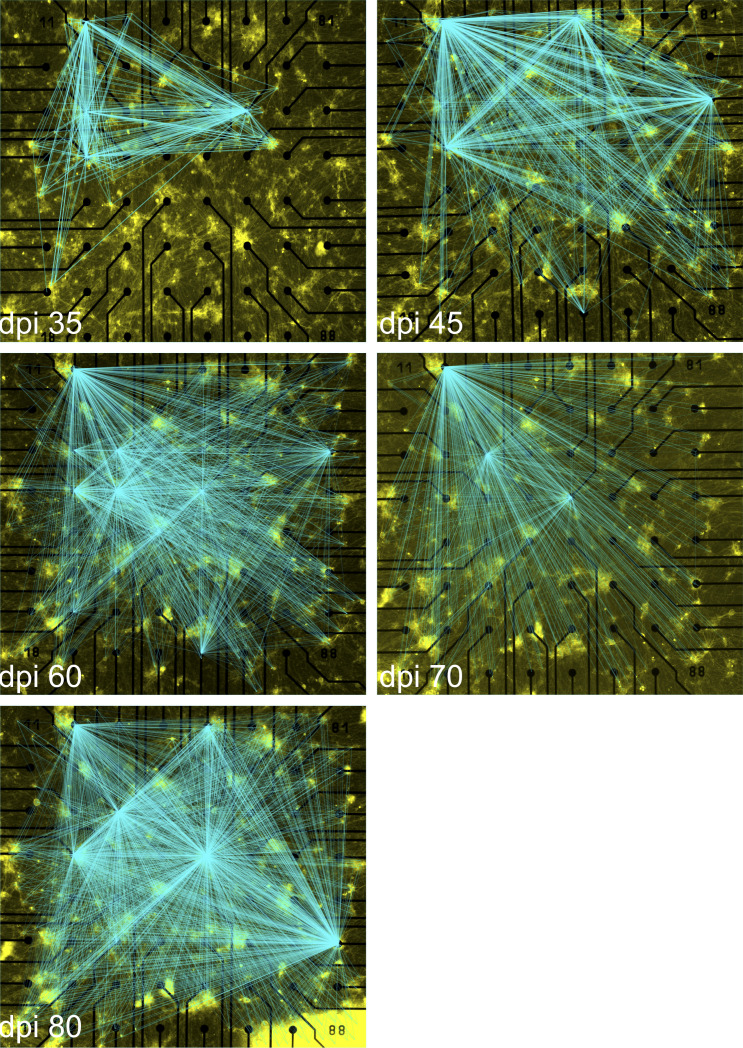
Figure S9. Network connectivity map at different days post induction overlaid on the fluorescence image of the sample.
These images are the magnified views of the connectivity maps that are represented in Fig 6A. Distance between electrodes is 200 μm.

