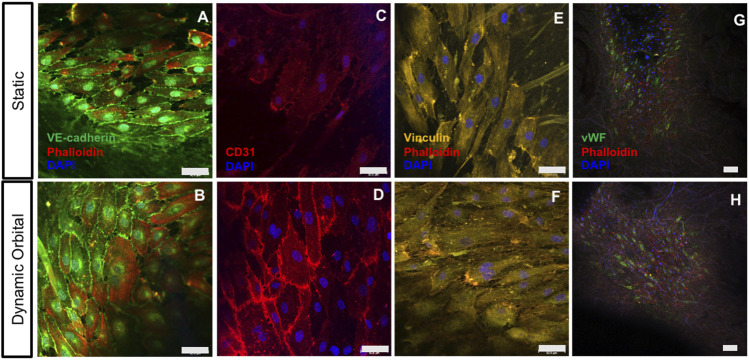
FIGURE 3.
ECFCs cultured on hTEMs express characteristic EC markers after 14 days. (A–B): ECFCs stained for VE-CAD (green), Phalloidin (red), and DAPI (blue) show confluent endothelialization and expression of cell-cell surface markers under both static and dynamic orbital conditions. (C–D): ECFCs stained for CD31 (red) and DAPI (blue) show the expression of ECFCs intercellular junctions under static and dynamic flow conditions. (E–I): Staining for Vinculin (yellow), Phalloidin (red) and DAPI (blue) demonstrating the expression of focal adhesions by ECFCs. (G–H): Staining for vWF (green), Phalloidin (red), and DAPI (blue) demonstrate endothelium functionality (50 µm scale bars).

