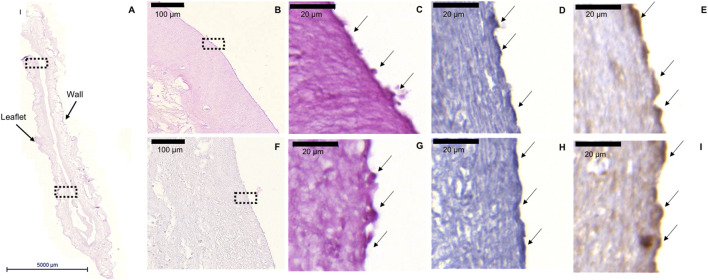
FIGURE 7.
ECFCs retention after TESV crimping procedure. Representative images of the H&E, CD31, and vWF stainings performed on the cross section of the valve. (A): H&E staining shows general morphology of TESV (5000 µm scale bar). (B,F): ×20 magnification pictures of the H&E staining of the upper (B) and lower (F) leaflet of the valve showing the presence of ECFCs on the surface (100 µm scale bars). (C,G): ×100 magnification pictures of H&E staining of the upper (C) and lower (G) leaflet marked by the dotted rectangles in panels (B,F) respectively (20 µm scale bars). (D,H): ×100 magnification pictures of CD31 staining shows ECFCs presence in the upper (D) and lower (H) leaflet (20 µm scale bars). (E,I): ×100 magnification pictures of vWF staining expressed by ECFCs in the upper (E) and lower (I) leaflet (20 µm scale bars).

