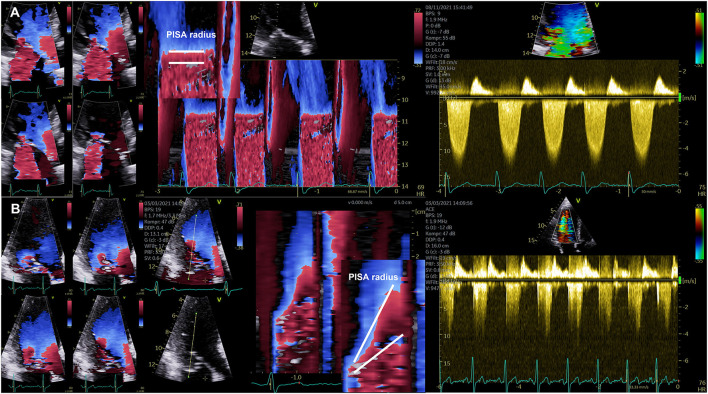
Figure 3.
Illustration of the dynamics of the PISA radius in mitral regurgitation (MR). (A) Documentation of almost stable PISA radius in a patient with secondary MR. On the left side four consecutive images during systole are shown illustrating the almost constant PISA radius. Right to these images a color-coded M-Mode illustrating the horizontal PISA radius and the continuous wave Doppler spectrum are shown. (B) Documentation of severe late systolic increase of PISA radius in a patient with primary MR. On the left side four consecutive images during systole are shown illustrating the significant increase of PISA radius at late systole. Right to these images a color-coded M-Mode illustrating the dynamics of the PISA radius and the continuous wave Doppler spectrum with the late time-to-peak regurgitant flow velocities are shown.

