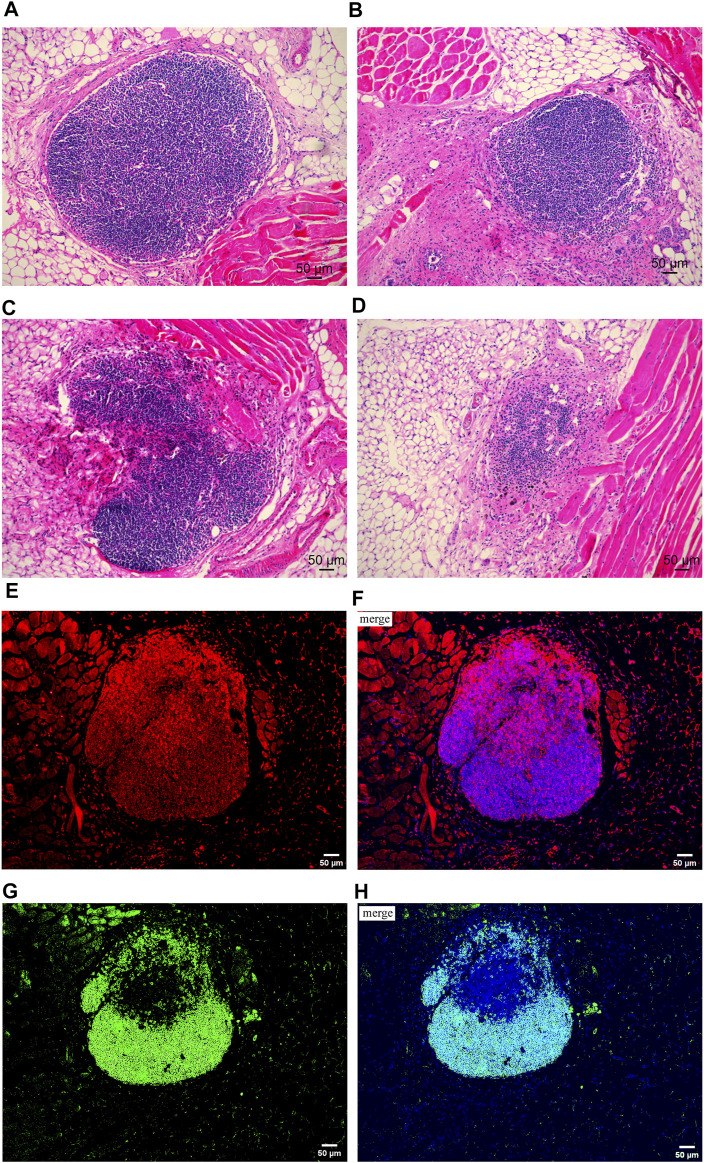
FIGURE 2.
Hematoxylin and eosin staining on transplanted lymph nodes and immunofluorescence staining on T cells and B cells. (A) Example of normal node ranked 3. (B) Example of node ranked 2, nodes with some abnormality (evidence of ischemic damage and loss of cellularity). (C) Example of node ranked 1, partial nodes or nodes with severe damage. (D) Example of node ranked 0, lymph nodes absent (tissue resorbed). (E,F) Distribution of T cells in transplanted lymph nodes. (E) Red fluorescence represented CD3+ cells (T cells) and (F) was the merged image; the red fluorescence represented target protein CD3, and the blue fluorescence represented cell nucleus. (G,H) Distribution of B cells in transplanted lymph nodes. (G) Green fluorescence represented CD45 + cells (B cells) and (H) was the merged image; the green fluorescence represented target protein CD45, and the blue fluorescence represented cell nucleus.

