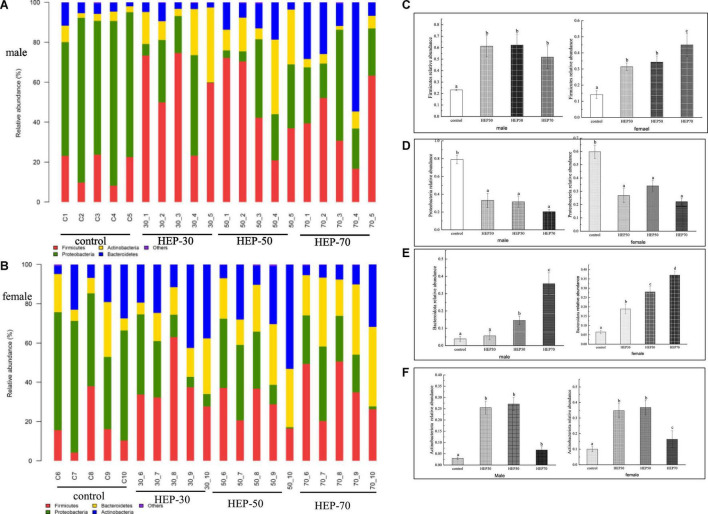
FIGURE 7.
The relative abundance of gut microbiota community at the phylum level in vitro fermentation. (A), male; (B), female; (C), Firmicutes; (D), Proteobacteria; (E), Bacteroidetes; (F), Actinobacteria. Data are means ± SD (5 independent experiments). a,b,cDifferent letters indicated a significant difference between the two groups (p < 0.05).

