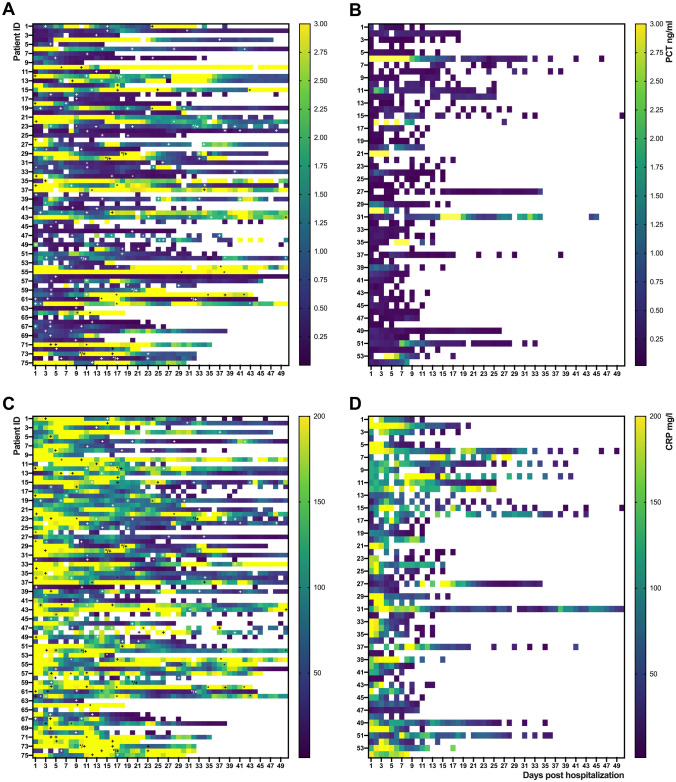
Fig. 3.
Course of PCT and CRP of COVID-19 patients on ICU with and without nosocomial co-infections. Heat map visualization of PCT and CRP levels over time (d1-50 beginning on admission to Charité hospital) of patients with nosocomial infections (left panels, A PCT and C CRP) and without proven nosocomial infection (right panels, B PCT and D CRP). Every row represents one patient and each column 1 day. In A and C “ + ” represents a positive microbiological respiratory sample and “*” a confirmed blood stream infection. CRP c-reactive protein; PCT procalcitonin; d day

