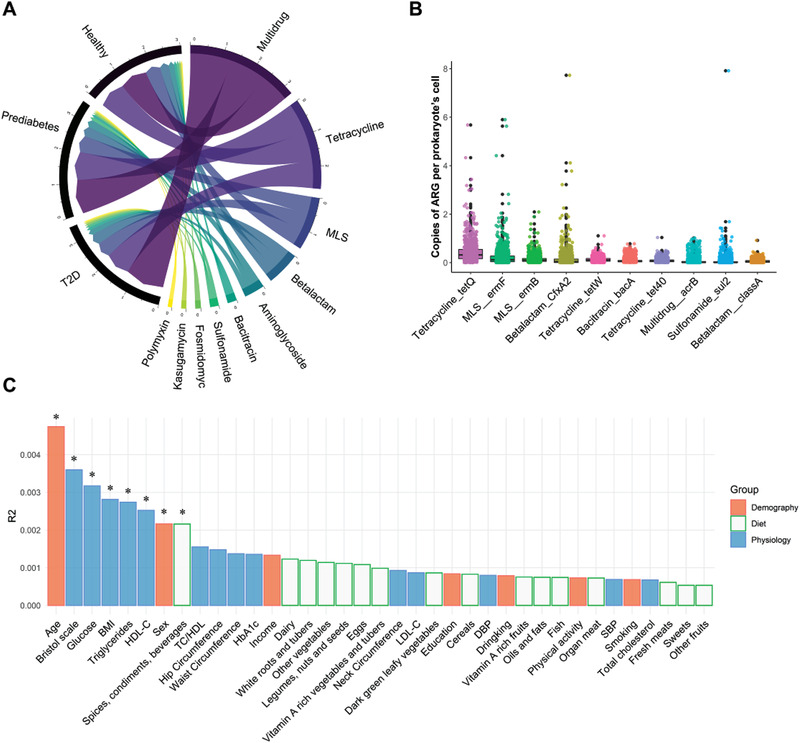
Figure 2.

Compositional variation in human gut antibiotic resistome. A) Circus plot showing the mean relative abundance of top 10 antibiotic resistance genes (ARGs) types among Healthy (n = 531), Prediabetes (n = 495) and Type 2 Diabetes (T2D, n = 184) groups. B) Box plot showing the abundance of top 10 ARGs subtypes (n = 1210). C) The effect sizes of host factors on human gut antibiotic resistome were calculated by PERMANOVA (Adonis, permutations = 999) (n = 947). MLS, Macrolide‐Lincosamide‐Streptogramin.
