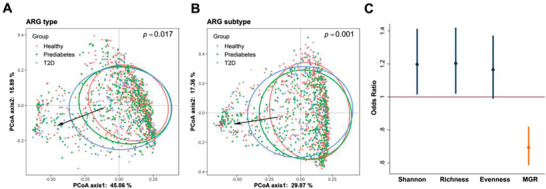
Figure 3.

Gut antibiotic resistance genes are associated with type 2 diabetes. A,B) PCoA plots showing the compositional differences of gut antibiotic resistome among different diabetes groups. p was calculated by PERMANOVA (Adonis, permutations = 999) based on Bray‐Curtis distance. C) Forest plot showing the odds ratio of T2D for each α‐diversity index of gut antibiotic resistome (in SD unit). Logistic regression models were adjusted for age, sex, BMI, smoking status, drinking status, education attainment, household income level, physical activity, Bristol stool scale, sequencing depth and microbial gene richness (MGR). The error bars represent confidence intervals. * p < 0.05.
