
Figure 4.
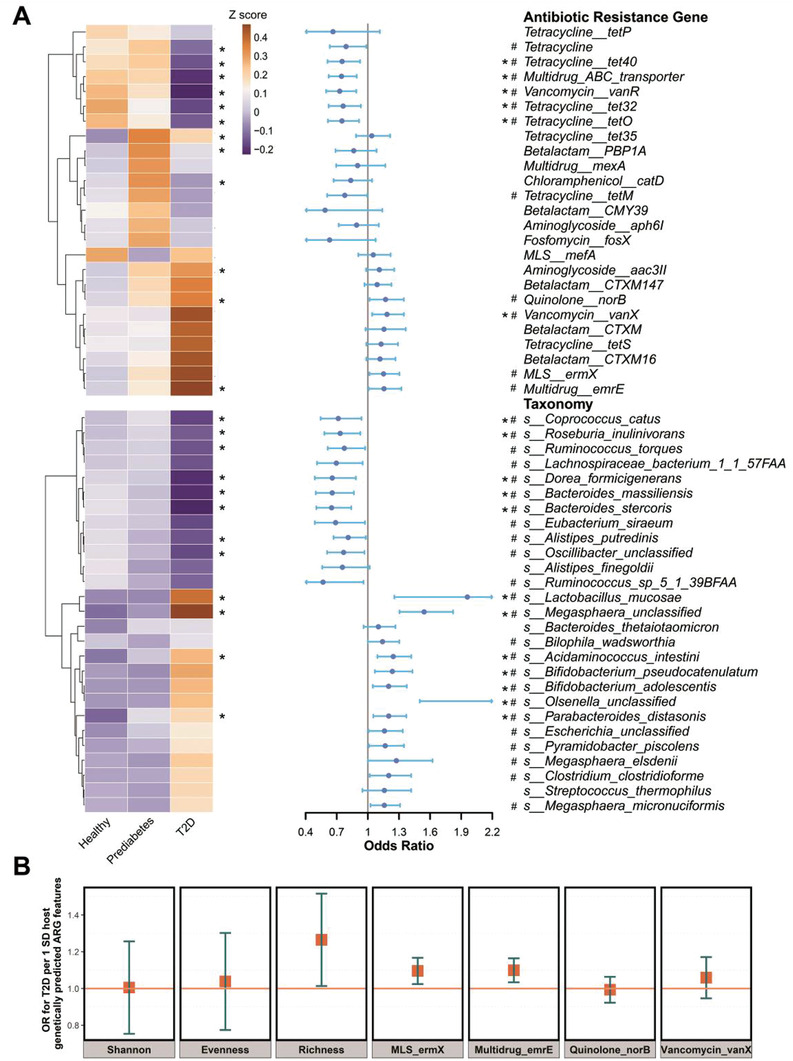
Shifts in gut antibiotic resistome and microbial species with diabetes status. A) Left heatmap shows the mean relative abundance (scaled by z score normalization) of the 25 identified T2D‐related ARGs and 27 identified T2D‐related microbial species from LASSO model. The abundance differences of these markers in healthy, prediabetes and T2D groups were examined by Kruskal–Wallis test. Right forest plot shows the odds ratio of T2D for each marker. Logistic regression models were performed, adjusted for age, sex, BMI, smoking status, drinking status, education attainment, income level and physical activity. The error bars represent confidence intervals. B) Mendelian randomization analysis (n = 947). Forest plot shows the odds ratios (95% confidence intervals) of T2D (outcome) per standard deviation increase in the host genetically predicted levels of the above identified ARG features (exposure). p values were corrected by Benjamini‐Hochberg method. MLS, Macrolide‐Lincosamide‐Streptogramin. *FDR‐corrected p < 0.05. #raw p < 0.05.