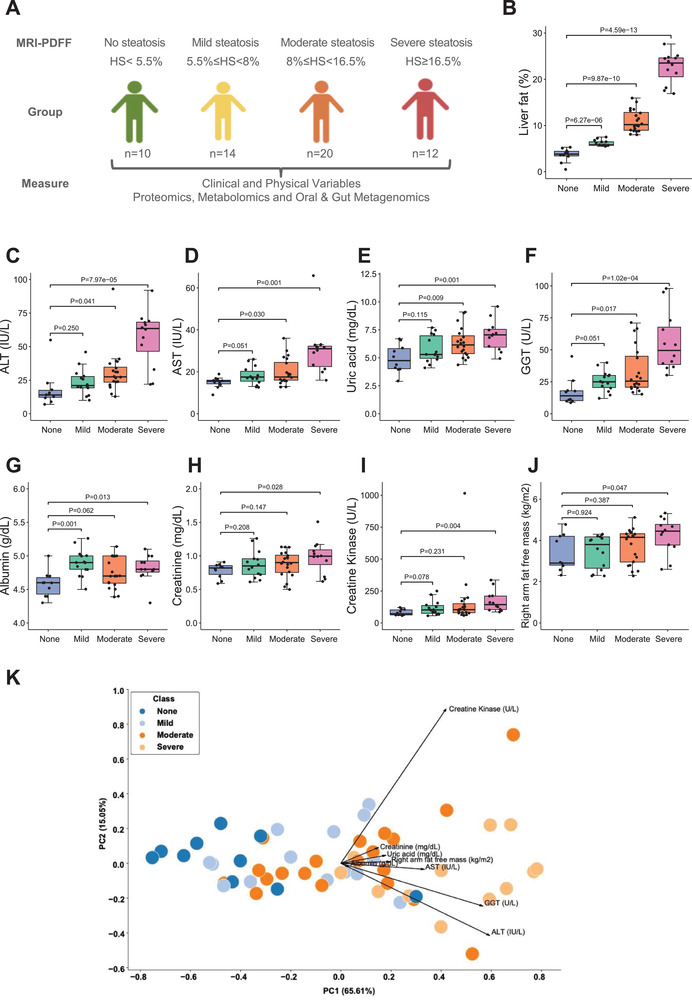
Figure 1.

A) The design of the study. Subjects were stratified into four distinct groups based on the hepatic steatosis percentages measured using MRI‐PDFF. The sample sizes of none, mild, moderate, and severe steatosis groups are 10, 14, 20, and 12, respectively. B) The boxplot shows hepatic steatosis of subjects with none, mild, moderate, and severe steatosis. Student's t‐test was used for statistical analysis. C–J) Significantly different clinical parameters are presented in subjects with none, mild, moderate, and severe steatosis. Student's t‐test was used for statistical analysis. K) PCA of all subjects based on eight significantly different clinical and physical variables shows good separation.
