
Figure 1.
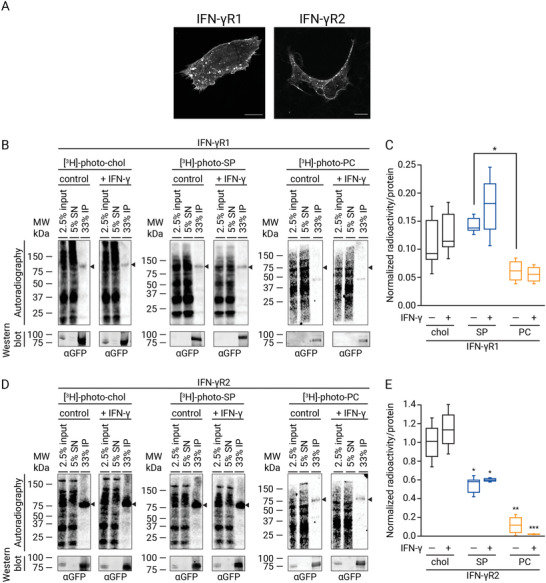
IFN‐γR interacts with chol and SP but not with PC in vivo prior to and following IFN‐γ stimulation. A) Fluorescence microscopy images of transiently expressed full‐length IFN‐γR1‐ and IFN‐γR2‐GFP tagged proteins localization in CHO cells. Scale bar = 20 µm. B,C) In vivo photoaffinity labeling of IFN‐γR1 using tritiated and photolabile chol, SP, and PC. In (B) CHO cells transiently expressing IFN‐γR1‐GFP and IFN‐γR2‐Luc constructs were treated with 100 µCi (3 µm), 60 μCi (2 µm) of the bifunctional chol and SP analogues for 6 h, respectively. For PC labeling, cells were treated with 50 μCi (2 µm) [3H]‐choline combined with 100 µm 10‐ASA for 6 h. Before ultraviolet irradiation, cells were treated for 5 min with IFN‐γ (1000 U mL−1) or vehicle. Finally, cells were lysed, subjected to immunoprecipitation against the GFP epitope and input, supernatant (SN), and immunoprecipitation (IP) were analyzed by western blot and digital autoradiography (n = 3 independents experiments). C) Quantification of immunoprecipitated radioactivity/IFN‐γR1 protein for chol, SP, and PC binding (data are the mean ± SD; n = 3 independent experiments). Data were normalized to IFN‐γR2WT‐chol interactions. D,E) In vivo photoaffinity binding IFN‐γR2WT with bifunctional chol, SP, and PC lipids in living cells. D) CHO cells transiently expressing the IFN‐γR2‐GFP/IFN‐γR1‐Luc constructs were treated and handled as described in (B) (n = 3 independents experiments). E) Quantification of immunoprecipitated radioactivity/IFN‐γR2 protein for chol, SP, and PC binding (data are the mean ± SD; n = 3 independent experiments. The line on each of the boxes represents the median for that particular data set). Arrow, expected protein sizes. Statistical significances were determined with one‐way ANOVA Bonferroni‘s multiple comparison test, and is represented compared to IFN‐γR2WT‐chol interactions (***p < 0.001; ns: not significant).