Figure 3.

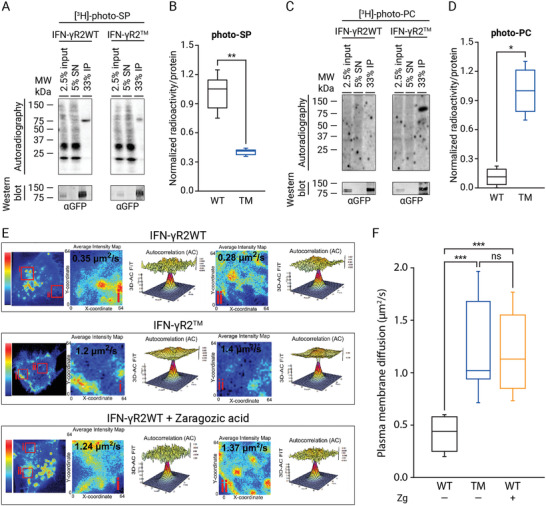
Chol regulates IFN‐γR2 lipid nanodomains partition. A) In vivo photoaffinity binding of SP to IFN‐γR2WT and IFN‐γR2TM in HAP1IFN‐γR2KO cells. B) Quantification of immunoprecipitated radioactivity/protein for SP binding (data are the mean ± SD; n = 3 independent experiments). C) In vivo photoaffinity binding of PC to IFN‐γR2WT and IFN‐γR2TM in HAP1IFN‐γR2KO cells. D) Quantification of immunoprecipitated radioactivity/protein for PC binding (data are the mean ± SD; n = 3 independent experiments). E,F) Loss of chol‐binding altering the two binding partners independently increases IFN‐γR2 plasma membrane mobility. E) Average intensity projection map (Pseudocolor LUT scale represent normalized average fluorescence intensity) example of transiently expressed IFN‐γR2WT (control or treated with Zg) and IFN‐γR2TM proteins in the cell surface of HAP1IFN‐γR2KO cells (left panels). Close‐up images of subregions corresponding to the two red boxes (i and ii) selected in the left panels in which RICS analysis was performed and displaying the corresponding 2D autocorrelation fit diffusion analysis for selected regions (i and ii); displayed is the 3D representation of the fit with its associated residuals. The resultant IFN‐γR2 diffusion coefficient for each region is marked (right panels). F) RICS quantification of transiently expressed full‐length IFNγR2WT (control or Zg treated) and IFN‐γR2TM protein diffusions through the PM of living HAP1IFN‐γR2KO cells. Data represent the mean of n = 3 independent experiments ± SD. n = 45 cells/condition. p‐values of one‐way ANOVA Bonferroni's multiple comparison test (***p < 0.001; **p < 0.01; *p < 0.05; ns: not significant) are given. The line on each of the boxes represents the median for that particular data set.
