
Figure 7.
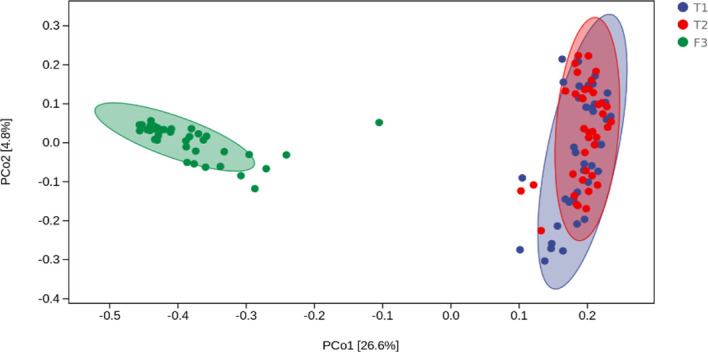
The principal coordinate analysis diagram of the composition of tongue coating and intestinal microbiota (the percentage in the brackets of the coordinate axis represents the proportion of sample difference data (distance matrix) that can be explained by the corresponding coordinate axis.).