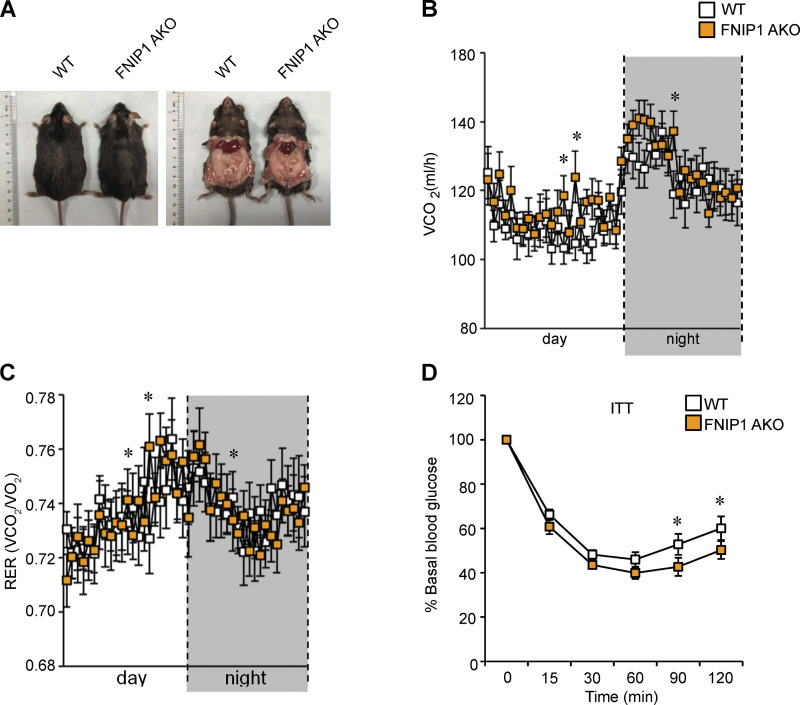
Figure S4.
Metabolic characterization of male FNIP1 AKO mice fed on a HFD. (A) Pictures of male mice fed with HFD for 16 wk. (B) Carbon dioxide production per hour during the light/dark cycle. n = 14–15 mice per group. (C) Respiratory exchange rate (RER) during the light/dark cycle. n = 14–15 mice per group. (D) ITT normalized to 100% at baseline. n = 13–16 mice per group. Values represent mean ± SEM. *, P < 0.05. P value was determined using two-way ANOVA and Fisher’s LSD post-hoc test. Data are representative of two independent experiments (A–D).

