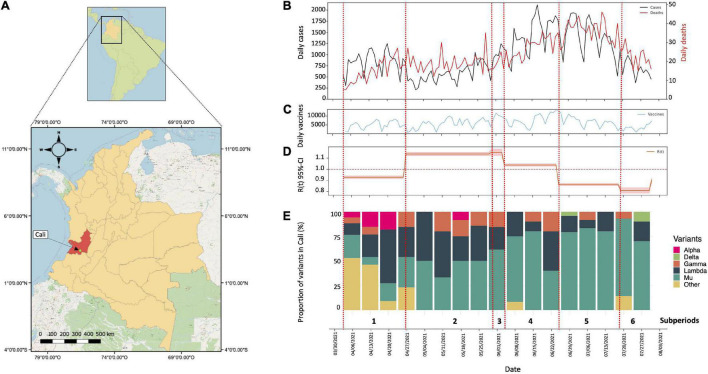
FIGURE 1.
Genomic surveillance and epidemic model of SARS-CoV-2 in Cali from 4 April 2021 to 31 July 2021. (A) Geographical location of the department of Valle del Cauca and its capital Cali. The map was constructed using the QGIS tools (QGIS Geographic Information System, Open-Source Geospatial) version 3.20.3-Odense. Foundation Project (http://qgis.osgeo.org). (B) Number of cases (black line) and deaths (red line) for SARS-CoV-2 reported daily in Cali from 4 April 2021 to 31 July 2021. (C) Number of vaccines applied per day in Cali from 4 April 2021 to 31 July 2021. (D) Value Rt calculated from 4 April 2021 to 31 July 2021. (E) Distribution of SARS-CoV-2 variants in Cali, Colombia. Proportion of VOC/VOI and other variants in Cali, Colombia from 4 April 2021 to 31 July 2021.

