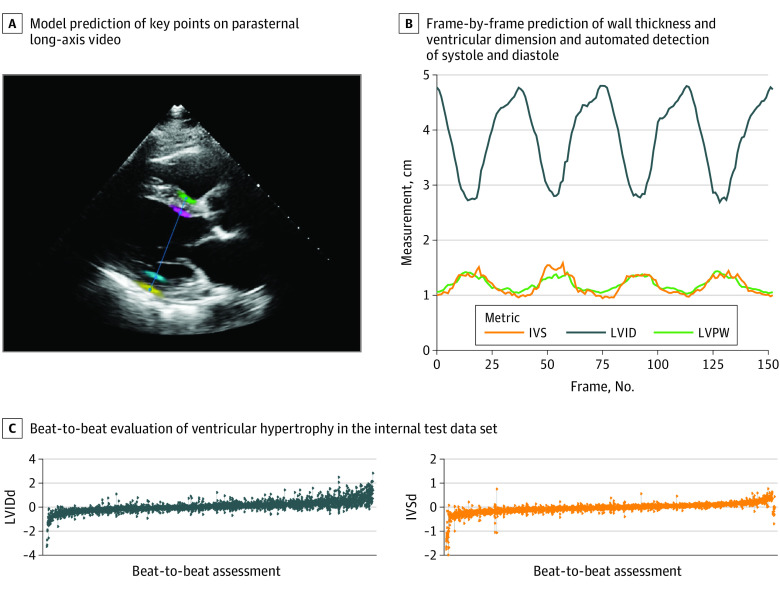
Figure 2. Beat-to-Beat Evaluation of Ventricular Dimensions.
A, Model prediction of key points on an individual frame of parasternal long-axis video. B, Frame-by-frame prediction of wall thickness and ventricular dimension and automated detection of systole and diastole allowing for beat-to-beat prediction of ventricular hypertrophy. C, Waterfall plot of individual video variation in beat-to-beat evaluation of ventricular hypertrophy (n = 2320) in the internal test data set. Each video is represented by multiple points along a line representing the measurement of each beat and a line signifying the range of predictions. IVS indicates intraventricular septum; IVSd, intraventricular septum (diastole); LVID, left ventricular internal dimension; LVIDd, left ventricular internal dimension (diastole); LVPW, left ventricular posterior wall.

