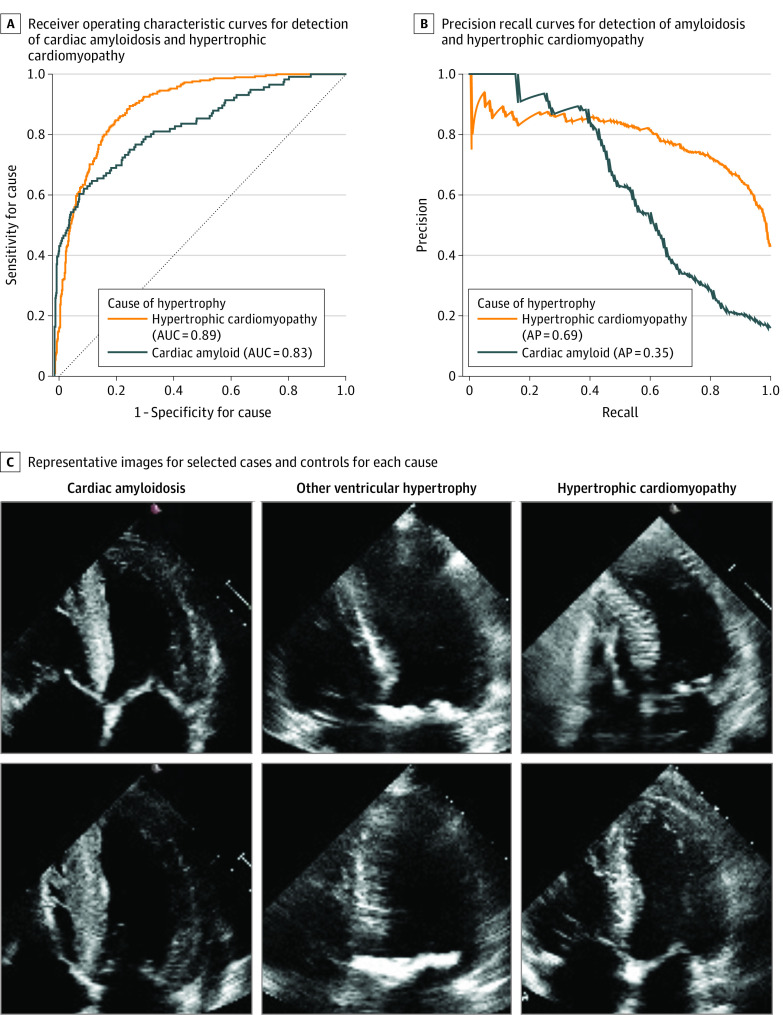
Figure 3. Performance of Disease Cause Classification in the Independent External Validation Cohort.
A, Receiver operating characteristic curves for detection of cardiac amyloidosis and hypertrophic cardiomyopathy in the Cedars-Sinai Medical Center independent external test set (n = 2351). B, Precision-recall curves for detection of amyloidosis and hypertrophic cardiomyopathy. C, Representative images for selected cases and controls for each cause. AP indicates average precision; AUC, area under the curve.

