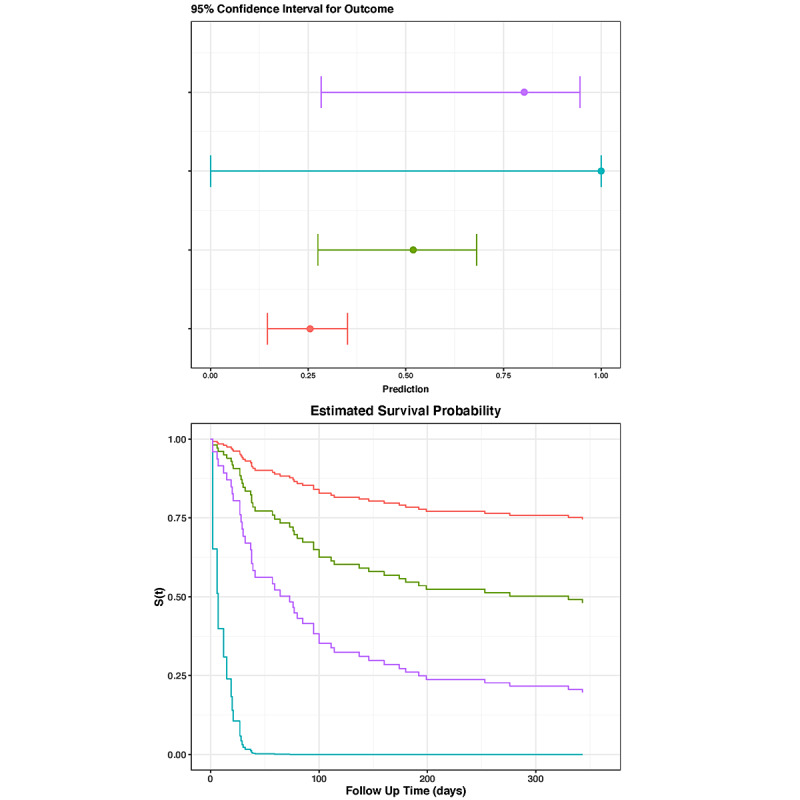
Figure 2.

Dynamic nomogram. Top: sliders that are used to enter data for age (standardized to 80 years) and white cell count (standardized to 10 x 109/L). Bottom: 4 imaginary scenarios, differing in BMI, creatinine, and lactate. The red, green, blue, and purple lines represent the following values for BMI, creatinine, and lactate, respectively: 25 kg/m2, 80 µmol/L, 1.5; 15 kg/m2, 80 µmol/L, 1.5 mmol/L; 15 kg/m2, 80 µmol/L, 4 mmol/L; and 15 kg/m2, 140 µmol/L, 4 mmol/L. The dynamic nomogram is available on our website [16].
