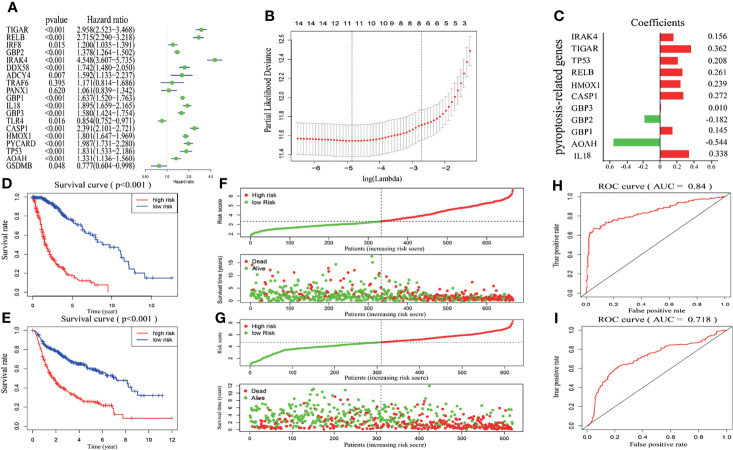
Figure 3.
Construction and validation of risk model. (A) Univariate analysis presents the hazard ratios and P-value of nineteen pyroptosis-related genes by the forest plot. (B) Cross-validation for adjusting parameter choice in LASSO regression analysis. (C) The risk signature containing eleven pyroptosis-related genes and the corresponding coefficients. (D, E) Kaplan–Meier survival curves for glioma patients from the TCGA (D) and CGGA (E) datasets in high- and low-risk groups. (F, G) Surveying the risk model in TCGA (F) and CGGA (G) datasets: distribution and survival status in glioma patients between the two risk groups. (H, I) The predictive efficiency of the risk score is presented by the ROC curves in both TCGA (H) and CGGA (I) datasets.

