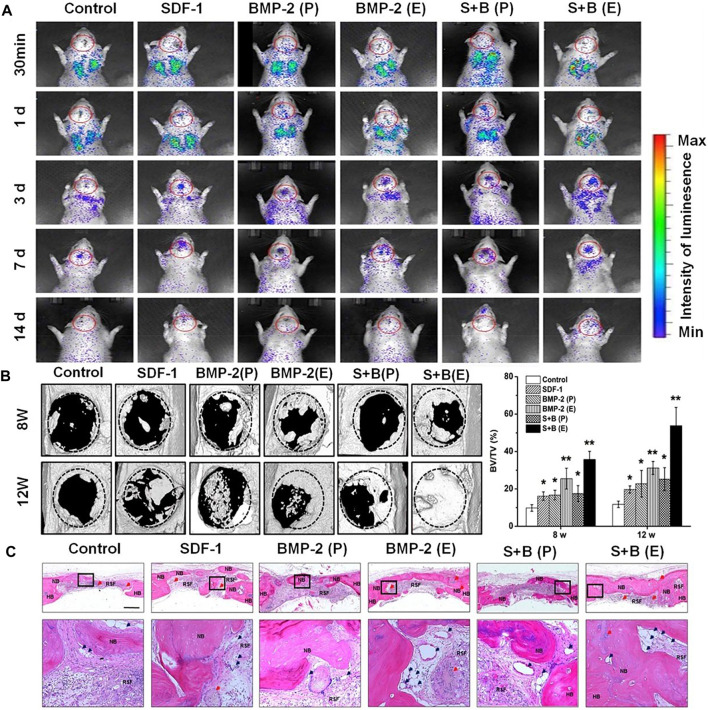
FIGURE 6.
(A) BMSC migration to the defect cranial site. Rats are shown at 30 min, 1, 3, 7 and 14 d post-injection; data indicate the systemic cell distribution of reporter cells. Red circles indicate the ROI. (B) CT results of critical size defect specimens and bone volume distribution. The circular plate in (B) represents the original skull defect. The white area above the circular plate and the light area inside the plate represent the newly formed bone. (C) Repair the skull cross-sectional structure (25 ×) with a stent 12 weeks after implantation. Ruler = 1 mm. After H & E staining, bone-like structures were detected in each group. The second line represents a higher magnification image (200 ×) of the corresponding box in the first line in (C). NB, HB and RSF represent new bone, host bone and residual silk fibroin, respectively. The red arrow shows the remaining microspheres. Blue arrows indicate newly formed blood vessels. BMP-2 (P): the scaffold material that physically adsorbs BMP-2, BMP-2 (E): SF microsphere coated BMP-2 scaffold, S + B (P): Scaffold material that physically adsorbs SDF-1 and BMP-2, S + B (E): The physical adsorption scaffold of SDF-1 and BMP-2 in SF microspheres. Reprinted with permission from (Shen et al., 2016).

