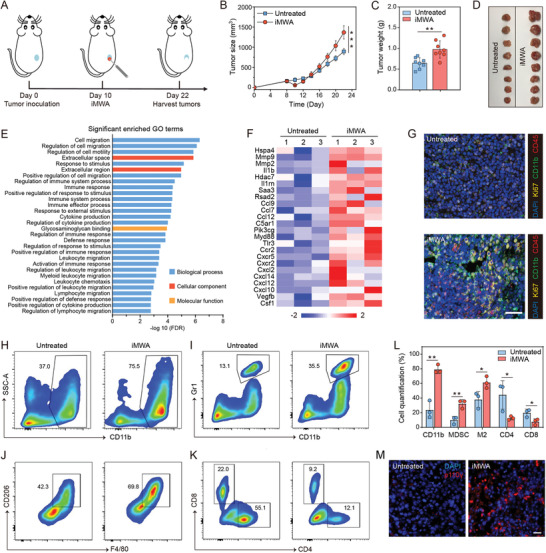
Figure 2.

iMWA promoting tumor progression and inducing immune suppression. A) Schematic illustration of inadequate microwave ablation (iMWA) treatment. B) Residual tumor growth kinetics and C) residual tumor weight of untreated and iMWA mice on day 22. Data are given as means ± standard deviation (SD) (n = 8). D) Photographs of tumors on day 22 in two groups. E) Significant enrichment in gene ontology (GO) terms. The y–axis shows GO categories, and the x–axis refers to the enrichment false discovery rate (FDR). F) Heat map of mean fold‐change in gene expression of chemokines and immune suppression (n = 3). G) Representative immunofluorescence images of residual tumors showing CD45+ cells, CD11b+ cells, and Ki67 infiltration. Scale bar: 25 µm. H) Representative flow cytometric analysis of CD11b+ cells and I) myeloid‐derived suppressor cells (MDSCs; CD11b+Gr1+) gating on CD45+ cells. J) Representative flow cytometric analysis of M2‐like macrophages (F4/80+CD206hi) gating on CD45+CD11b+ cells. K) Representative flow cytometric analysis of CD8+ and CD4+ T cells gating on CD45+CD3+ cells. L) Flow cytometric quantification of the above cells. Data are presented as means ± SD (n = 3). M) Representative immunofluorescence images of tumors showing p110γ (red) expression for untreated and iMWA groups. Tissues were counterstained with DAPI (blue) to detect nuclei. Scale bar: 20 µm. Statistical significance was calculated by Student's t test. *p < 0.05, **p < 0.01 and ***p < 0.001.
