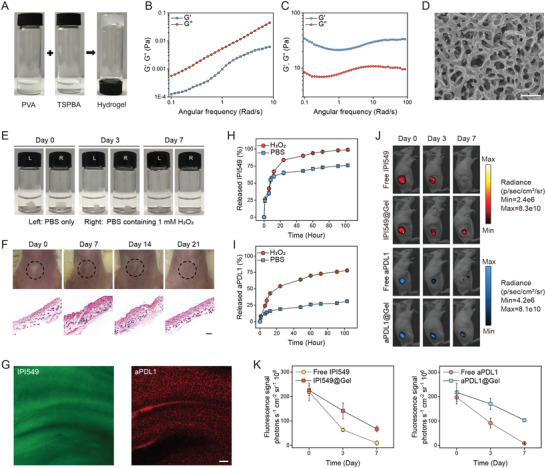
Figure 3.

Synthesis and characterization of in situ formed bioresponsive scaffold. A) Photographs of hydrogel formation. B) Frequency dependency of the elastic (G′) and viscous (G″) moduli of PVA and C) PVA‐TSPBA hydrogel samples. D) Cryo–scanning electron microscopy (Cyro‐SEM) image of hydrogel. Scale bar: 1 µm. E) ROS‐sensitive gel in PBS and H2O2 solution. F) Images of skins at the sites of injecting hydrogel and their corresponding hematoxylin and eosin (H&E) staining results at different time points. Black circles indicate hydrogel. Scale bar: 250 µm. G) Representative fluorescence images of the hydrogel in which fluorescein isothiocyanate (FITC) (green) was used as the substitution of IPI549 and anti‐programmed death‐ligand 1 blocking antibody (aPDL1) labeled with Cy5.5 (red) was used as the substitution of aPDL1. Scale bar: 5 µm. H) Cumulative release profiles of IPI549 and I) aPDL1 from hydrogel incubated in PBS with or without 1 mm H2O2. Data are presented as means ± SD (n = 3). J) In vivo retention of IPI549 and aPDL1 in different formulations at different days (days 0, 3, and 7) injected subcutaneously into CT26 tumor‐bearing BALB/c mice and K) their corresponding quantitative analysis of fluorescence signals. Data are presented as means ± SD (n = 3).
