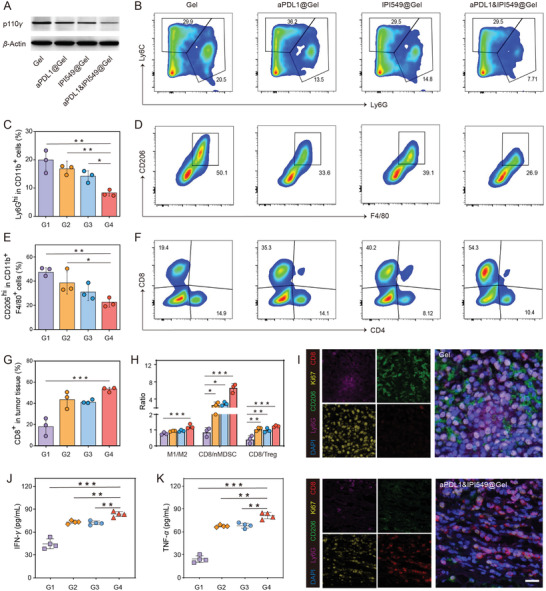
Figure 5.

The robust antitumor immune responses triggered by aPDL1&IPI549@Gel. A) Western blot of p110γ in residual tumors collected from mice in different groups. B) Representative flow cytometric analysis and C) quantification of nMDSCs (CD11b+Ly6Ghi) in CD45+ cells. Data are presented as means ± SD (n = 3). D) Representative flow cytometric analysis and E) quantification of TAMs‐M2 (CD206hi) in CD11b+F4/80+ cell population. Data are presented as means ± SD (n = 3). F) Representative flow cytometric analysis and G) quantification of CD8+ T cells in CD45+CD3+ cells. Data are presented as means ± SD (n = 3). H) Quantification by flow cytometry of M1/M2, CD8/nMDSC, and CD8/Treg ratios. Data are presented as means ± SD (n = 3). I) Representative immunofluorescence images of residual tumors displaying CD8+ T cell, Ki67, CD206, and Ly6G infiltration. Scale bar: 20 µm. J) Cytokine levels in sera including interferon‐γ (IFN‐γ) and K) tumor necrosis factor‐α (TNF‐α) from mice after different treatments. Data are presented as means ± SD (n = 4). G1, Gel; G2, aPDL1@Gel; G3, IPI549@Gel; G4, aPDL1&IPI549@Gel. Statistical significance was calculated by one‐way ANOVA with a Tukey post‐hoc test. *p < 0.05, **p < 0.01 and ***p < 0.001. aPDL1, anti‐programmed death‐ligand 1 blocking antibody; nMDSCs, neutrophilic myeloid derived suppressor cells; TAMs, tumor‐associated macrophages; M1, M1‐like macrophage; M2, M2‐like macrophage; Treg, regulatory T cell.
