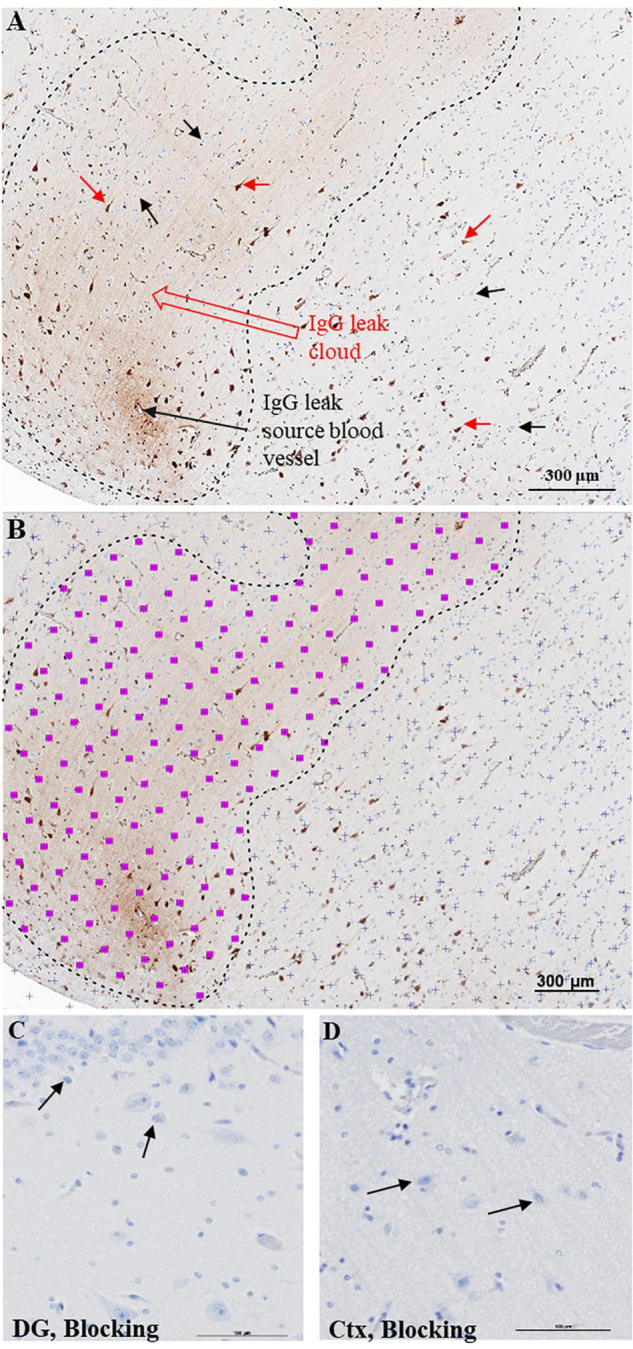
FIGURE 1.

Semi-quantitative approach to quantify BBB breach extent. (A) Bright field DAB image of cerebral cortex demonstrating extravasation of IgGs from a leaky blood vessel. The IgG leak forms a characteristic ‘leak cloud’ marked between black dotted lines. Certain pyramidal neurons located within and outside the leak cloud display selective immunoreactivity for IgGs (red arrows), while a larger number of pyramidal neurons fail to show IgG immunoreactivity (black arrows). (B) Processed image to measure selective IgG immunoreactivity area using Cavalieri estimator function of stereology software grid system to define non-immunoreactive areas of tissue (purple + marks) and immunoreactive areas (pink squares with purple + marks). This software estimates IgG leak fraction for each section. Scale bar = 300 μm. Hippocampal (C) and cortical (D) regions from a control slide probed with only 2% blocking serum and ABC reagent. DG = dentate gyrus, Ctx = Temporal cortex, Scale bar = 100 μm.
