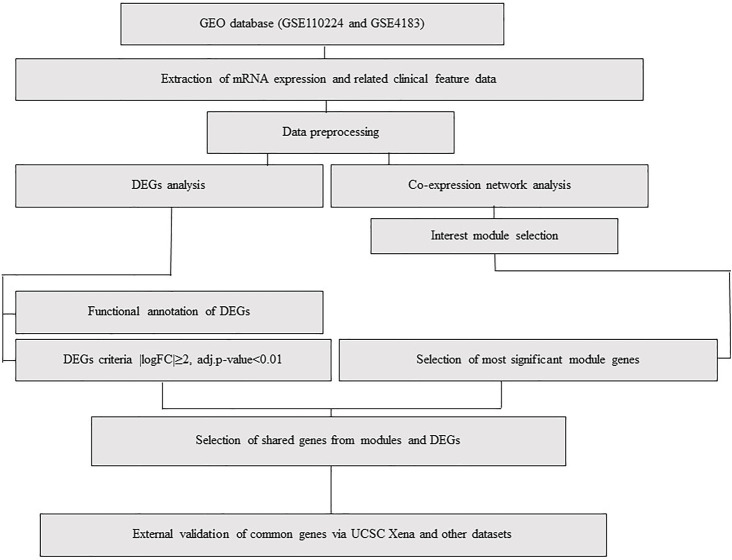
FIGURE 1.
Flowchart, including data preparation, processing, and analysis of CRC and IBD datasets. The CRC dataset (GSE110224) includes 17 CRC samples and 17 matched normal samples from each patient (n = 34). The IBD dataset (GSE4183) includes eight normal colon tissue samples and 15 colon IBD samples (n = 23).

