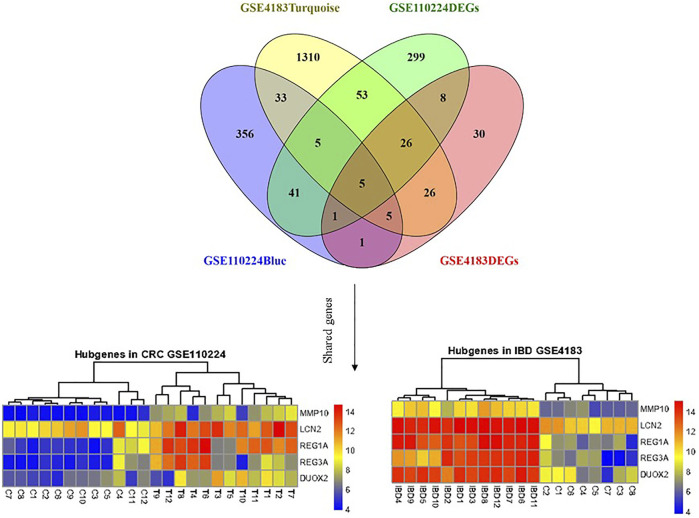
FIGURE 5.
Shared gene expression in CRC and IBD patients compared to normal control tissues. The left side shows the varied expression values between CRC tissues in comparison with adjacent normal tissue, and the right plot illustrates the expression of candidate genes between IBD and corresponding normal control tissues. The upregulated and down-regulated genes are shown as red and blue tiles, respectively.

