
Fig. 1.
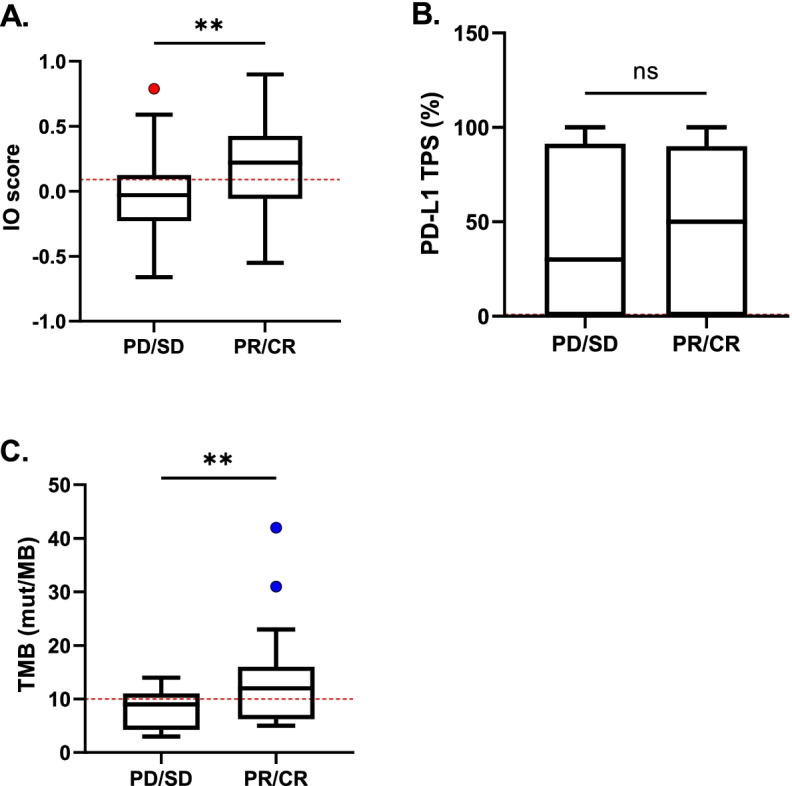
Comparisons between biomarker measurements and response to ICI therapy. A-C IO score (n = 67), PD-L1 TPS (n = 53), and TMB (n = 36) were plotted as a continuous variable by responders (CR, PR) and non-responders (PD, SD). Box and whisker plots are shown. For reference, the positivity thresholds are indicated as dashed red lines at ≥0.09 for IO score, ≥1% for PD-L1 TPS, and ≥ 10 mut/MB for TMB. PD, progressive disease; SD, stable disease; PR, partial response; CR, complete response. Comparisons between groups were conducted using Welch’s t-test. **p < 0.01