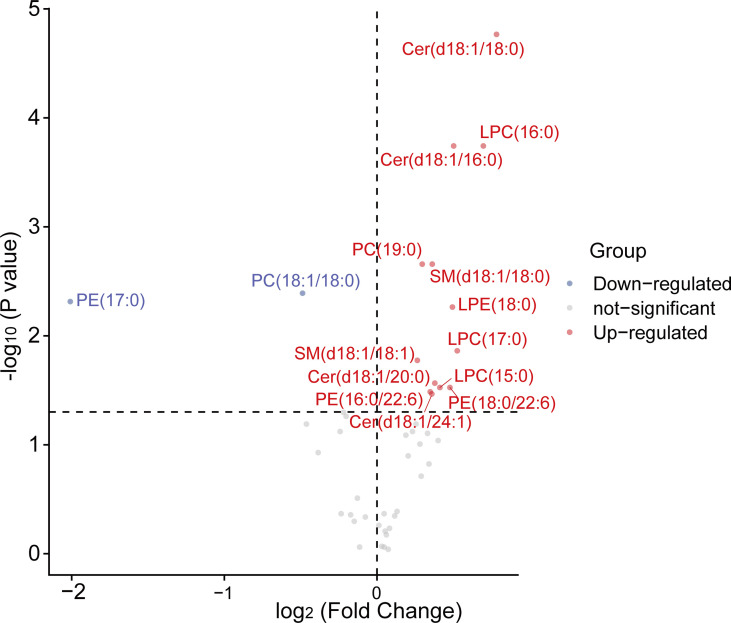
Figure 1.
The volcano plots of 45 serum lipids levels between control and T2DM groups. A total of 15 lipids exhibited significant differential abundance (P < 0.05) with 2 of them down-regulated and 13 of them up-regulated when comparing T2DM patients to control. Mann-Whitney U tests were used to calculate statistical significance. Differentially lipid species with different fold changes were individually color-coded with up-regulated lipids in red, down-regulated in blue, and not-significant in grey. LPC, lysophosphatidylcholine; PE, phosphatidylethanolamine; LPE, lysophosphatidylethanolamine; PC, phosphatidylcholine; SM, sphingomyelin; Cer, ceramide.

