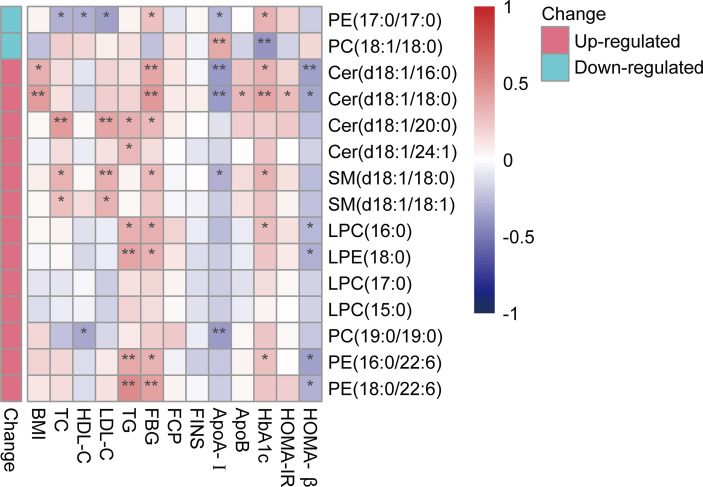
Figure 2.
Correlation heatmap between differentially abundant lipids and key clinical characteristics. A bipolar color progression with scales on the right of the figure represented positive correlation (red) and negative correlation (blue), respectively. Statistical significances are indicated by asterisks. *P < 0.05; **P < 0.01. LPC, lysophosphatidylcholine; PE, phosphatidylethanolamine; LPE, lysophosphatidylethanolamine; PC, phosphatidylcholine; SM, sphingomyelin; Cer, ceramide.

