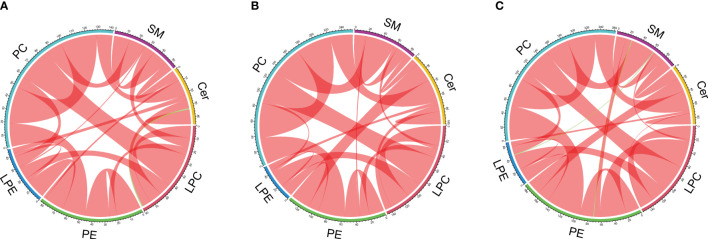
Figure 5.
Chord diagrams of significant (P<0.05) pairwise correlations between lipids for the control group (A), T2DM patients before exenatide treatment (B), and T2DM patients after exenatide treatment (C) respectively. The colored arcs outside of the circle represent 6 lipid classes. Significant correlations between every pair of lipid species are depicted by sectors, with red representing positive correlation and green representing negative correlation. Bandwidth corresponds to the number of correlated pairs. LPC, lysophosphatidylcholine; PE, phosphatidylethanolamine; LPE, lysophosphatidylethanolamine; PC, phosphatidylcholine; SM, sphingomyelin; Cer, ceramide.

