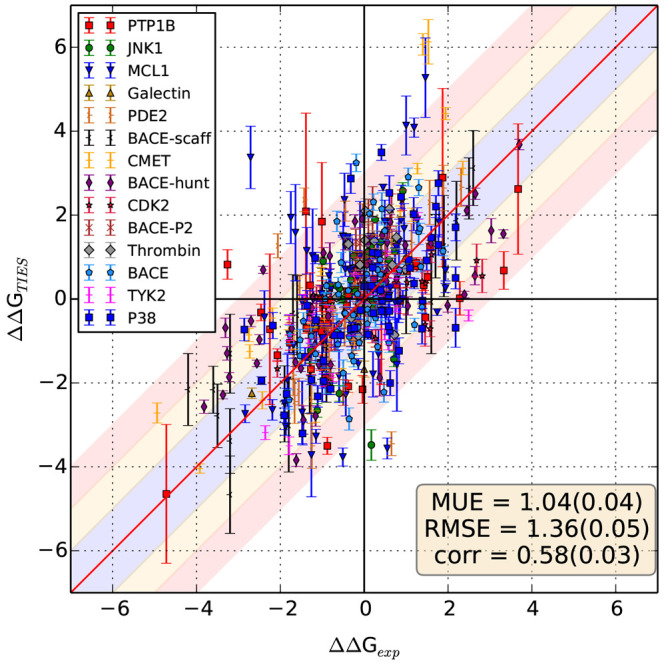
Figure 1.

Correlation between experimental and calculated ΔΔG values for all systems studied. The text box includes statistical measures of agreement–mean unsigned error (MUE), root mean squared error (RMSE), and Pearson correlation coefficient (corr) for the entire data set along with their standard errors in parentheses. The red line denotes the perfect correlation line (y = x), and the ±1, ±2, and ±3 regions have been shaded with different colors. All values are in kcal/mol. Error bars are not available for experimental data.
