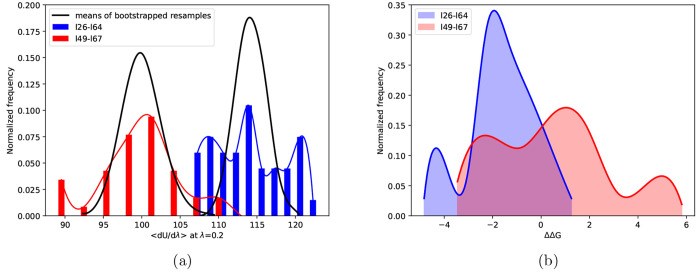
Figure 2.
(a) Distributions of potential energy derivatives and their corresponding means of bootstrapped resamples for two MCL1 ligand pairs using 40 replicas per λ window; the distributions of energy derivatives (shown in blue and red as bar and solid line plots) exhibit non-normality, whereas the distributions of means of resamples of size 5 obtained using bootstrapping (shown in black as solid line plots) are normal owing to the central limit theorem. (b) Distributions of ΔΔG values for the same two ligand pairs (shown in blue and red as solid line plots with the underlying area shaded).

