FIGURE 2.

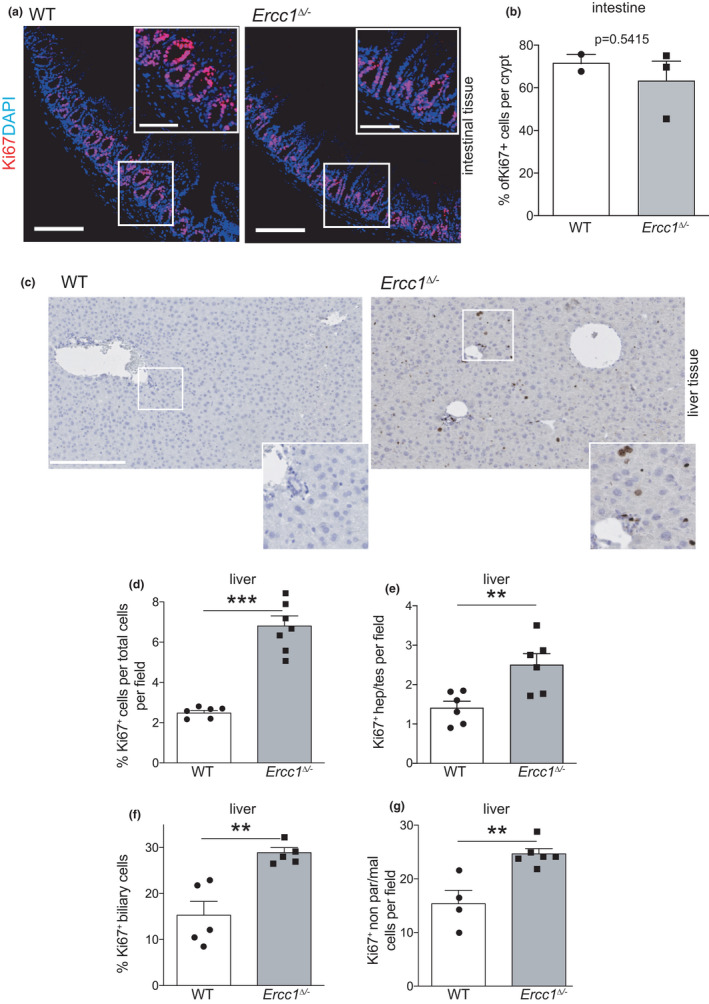
Steady‐state regenerative potential of intestine and liver of progeroid Ercc1Δ /− mice. (a) Immunofluorescence of intestinal tissue sections from 15‐week‐old wt and mutant mice stained for proliferation marker Ki67, nuclei counterstained with DAPI. Insets here and in other panels are digitally magnified images. Bars 10 μm (5 μm for insets). (b) Steady‐state proliferative index of small intestine from 15‐week‐old Ercc1Δ /− (n = 3) and control mice (n = 2). (c) Immunohistochemical staining for proliferation marker Ki67 of liver from 15‐week‐old Lgr5EGFPErcc1Δ /− and wt mice. Nuclei counterstained with haematoxylin. Bars 250 μm. (d) Proliferative index of Lgr5EGFPErcc1Δ /− liver. Quantitation of Ki67+ cells per total cells in a field as represented in (c) from 15‐week‐old mutant and wt mice. More than 5 fields were quantified from n = 7 mice per genotype. (e–g) Proliferative index of various cell populations (identified on morphology and location) in progeroid Lgr5EGFPErcc1Δ /− and wt liver. Note that nearly all cell populations in Ercc1Δ /− liver show increased proliferation. Over 5 fields were quantified from at least 4 mice per genotype. Data: mean ± SEM, **p < 0.01, ***p < 0.001
