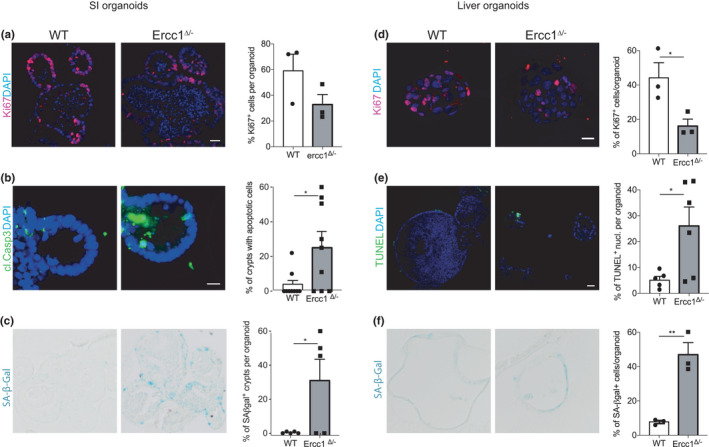
FIGURE 5.

Cell fate phenotypes in Ercc1Δ /− small intestinal and liver organoids. (a) Proliferation index of Ercc1Δ /− intestinal organoids. Immunostaining for Ki67 (red) in Ercc1Δ /− and wt control SI organoids in medium without Wnt3a supplementation. Bar 10 μm. Right, quantitation of proliferative, Ki67+ cells in organoids of the indicated genotypes (n = 3 mice per genotype). (b) DNA damage responses in Ercc1Δ /− SI organoids. Images of crypts of organoids, derived from 15‐week‐old Ercc1Δ /− and control mouse intestines, immunostained for cleaved Caspase‐3. Bar 10 μm. SI organoid crypts containing TUNEL+ cells. Each dot represents the measurement of individual organoid cultures and data from a sample size of 3 mice per genotype. (c) Images of SI organoids from 15‐week‐old mutant and wt mice, stained for senescence‐associated β‐galactosidase (SA‐βGal) activity. Crypts positive for SA‐βGal in organoids of the indicated genotypes. Each dot individual culture of organoids, data from 3 mice per genotype. (d) Immunostaining for Ki67 of liver organoids from 15‐week‐old Ercc1Δ /− and wt mice. Bar 20μm. Proliferation index of organoids (n = 3 mice per genotype). (e) Apoptosis in Ercc1Δ /− and wt liver organoids from 15‐week‐old mice. Bar 50 μm. Percentage TUNEL+ cells per organoid (n = 5 mice per genotype). (f) Histochemical staining for SA‐β‐Gal activity. Percentage of SA‐β‐Gal+ cells per Ercc1Δ /− and wt liver organoid (n = 3 mice per genotype). Data: mean ± SEM. *p < 0.05, **p < 0.01
