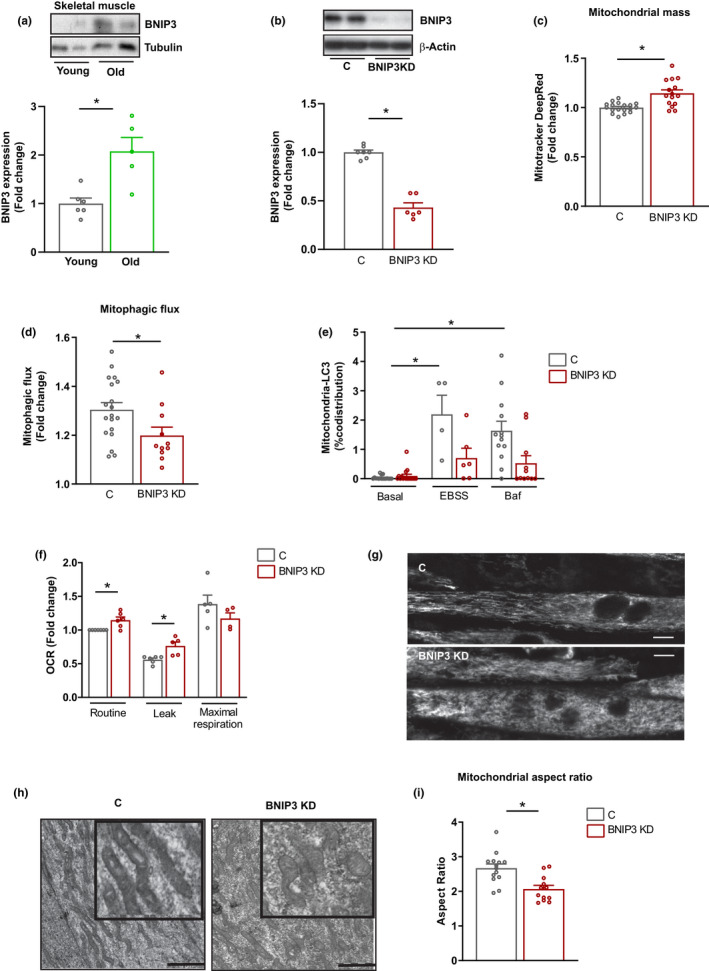
FIGURE 1.

BCL2 interacting protein 3 (BNIP3) regulates mitophagy and mitochondrial health in skeletal muscle cells. (a) BNIP3 protein expression in gastrocnemius muscle from young (4–6 months) and old (22–24 months) wild‐type (WT) mice (n = 5–6 mice per group). (b) BNIP3 protein expression in control (C) and BNIP3 knockdown (BNIP3 KD) C2C12 myotubes (n = 6). (c) Mitochondrial mass measured by Mitotracker Deep Red fluorescence by flow cytometry in C and BNIP3 KD cells (n = 12). (d) Mitophagic flux in C and BNIP3 KD myotubes determined by Mitotracker Deep Red fluorescence in the absence or presence of 200 nM bafilomycin A for 16 h. Data show the fold change in fluorescence of bafilomycin A‐treated cells vs. nontreated cells (n = 12). (e) Quantification of co‐distribution between cyclooxygenase 1 (COX1) and microtubule‐associated protein 1A/1B‐light chain 3 (LC3) in C and BNIP3 KD myotubes under basal, starvation (Earle's Balanced Salt Solution (EBSS)) and bafilomycin A‐treated conditions (n = 5–20 myotubes). (f) Mitochondrial oxygen consumption in C and BNIP3 KD myotubes in routine, oligomycin‐treated (leak), and carbonyl cyanide m‐chlorophenylhydrazone (CCCP)‐treated (maximal) conditions (n = 6). (g) Representative live confocal microscopy images of C and BNIP3 KD myotubes incubated with Mitotracker Deep Red to visualize mitochondrial morphology (scale bar 10 µm); (h) Representative transmission electron microscopy (TEM) images of mitochondria from C and BNIP3 KD myotubes (scale bar 1 µm). (i) Quantification of mitochondrial morphology by aspect ratio measurement of mitochondria from TEM images of C and BNIP3 KD myotubes (n = 12–15 images and 20–25 mitochondria per image). Data are expressed as mean ± SE. *p < 0.05
