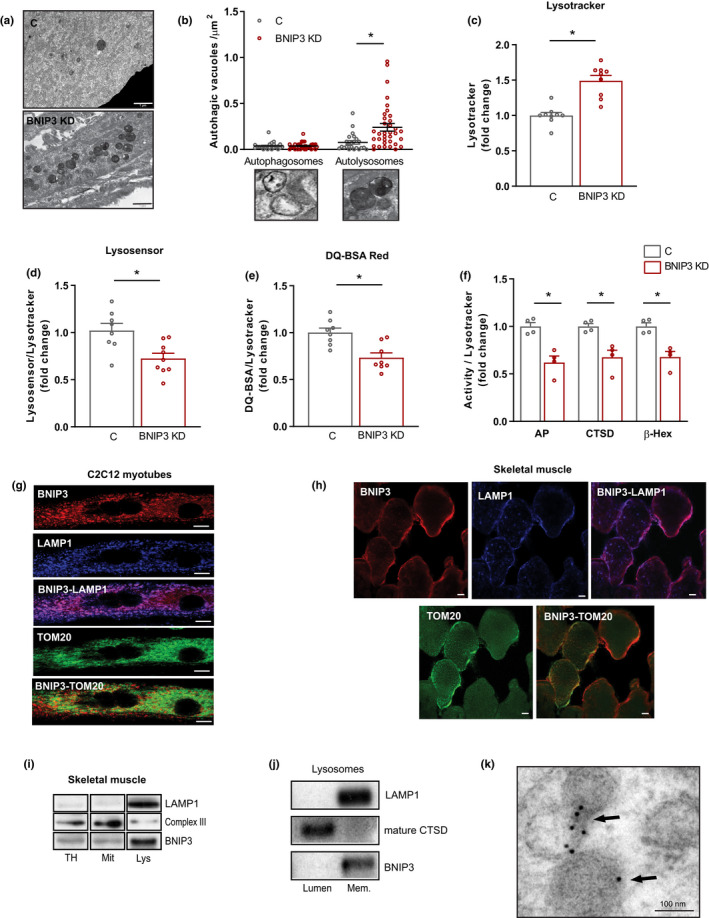
FIGURE 2.

BCL2 interacting protein 3 (BNIP3) regulates lysosomal function in skeletal muscle cells. (a) Representative transmission electron microscopy (TEM) images of control (C) and BNIP3 knockdown (BNIP3 KD) cells showing accumulation of electron‐dense vesicles in BNIP3 KD myotubes (scale bar 1 µm). (b) Quantification of autophagosomes and autolysosomes per µm2 in TEM images from C and BNIP3 KD myotubes (n = 25–30 images per genotype). (c) Lysosomal mass determination by Lysotracker Red fluorescence quantification by flow cytometry in C and BNIP3 KD myotubes (n = 9). (d) Lysosensor Blue quantification by flow cytometry corrected by lysosomal mass in C and BNIP3 KD myotubes (n = 9). (e) Dye quenched‐red bovine serum albumin (DQ‐Red BSA) quantification by flow cytometry corrected by lysosomal mass in C and BNIP3 KD myotubes (n = 8). (f) Lysosomal enzyme activity (acid phosphatase ‐AP‐, cathepsin D ‐CTSD‐, and β‐hexominidase ‐β‐Hex‐) corrected by lysosomal mass in total homogenates from C and BNIP3 KD myotubes (n = 4). (g) Representative immunofluorescence images of BNIP3, lysosomal‐associated membrane protein 1 (LAMP1), and translocase of the outer membrane 20 (TOM20) in myotubes (scale bar 10 µm). (h) Representative immunofluorescence images of BNIP3, LAMP1, and TOM20 in mouse gastrocnemius muscle (scale bar 10 µm). (i) Western blot (WB) analysis of BNIP3 in different pure fractions from mouse gastrocnemius muscle. LAMP1 was used as a lysosomal maker, and complex III as a mitochondrial marker (TH, total homogenate; Mit, mitochondria; Lys, lysosomes). (J) Western blot (WB) analysis of BNIP3 in lumen and membranes of pure lysosomes. LAMP1 was used as a lysosomal membrane marker and CTSD as a lysosomal lumen marker. (k) Immunogold TEM image showing the presence of BNIP3 in lysosomes from C2C12 myotubes (scale bar 100 nm). Data are expressed as mean ± SE. *p < 0.05
