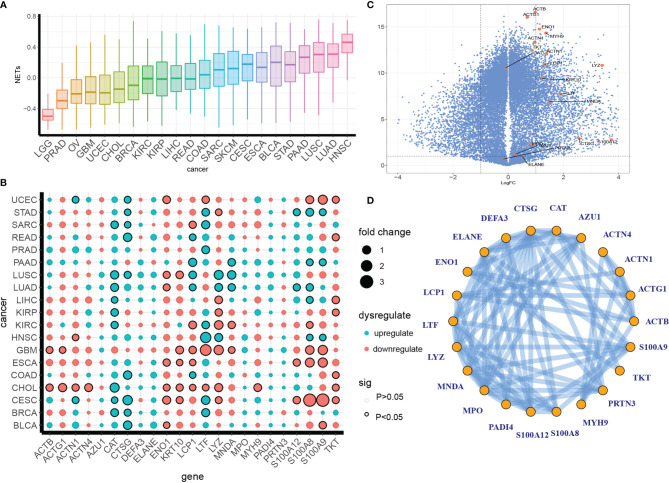
Figure 1.
Definition of a pan-cancer NET dysregulation profile. (A) A pan-cancer GSVA enrichment score profile of NETs. (B, C) Irregular expression patterns of NETosis genes in separate cancer types (B) or pan-cancer (C). The colors indicate up- or downregulation, and the dot size indicates the fold difference between tumor tissue and para-tumor tissue. The circle outlines indicate significance. (D) Protein–protein interactions of NETs proteins from the STING database.

