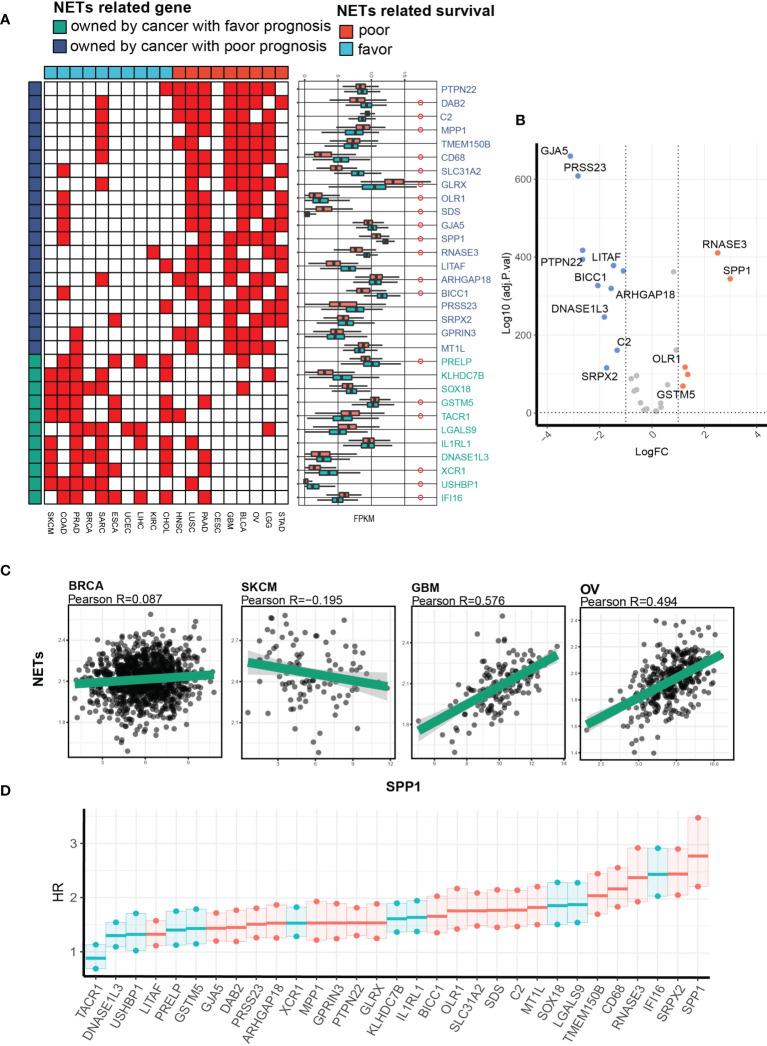
Figure 6.
Identification of SPP1 as a key NET-related gene facilitating NET-related malignancy. (A) A heatmap showing the NET-related genes with the highest correlation and differential expression between cancers with favorable or risk NET-related survival. (B) A volcano plot showing expression differences. (C) Representative Pearson correlation values between NET score and pan-cancerous SPP1 expression. (D) A univariate Cox proportional hazard model showing the hazard ratios for death in the NETs_high_gene_high group compared with the NETs_low_gene_low group in a pan-cancer cohort.

