Figure 2.

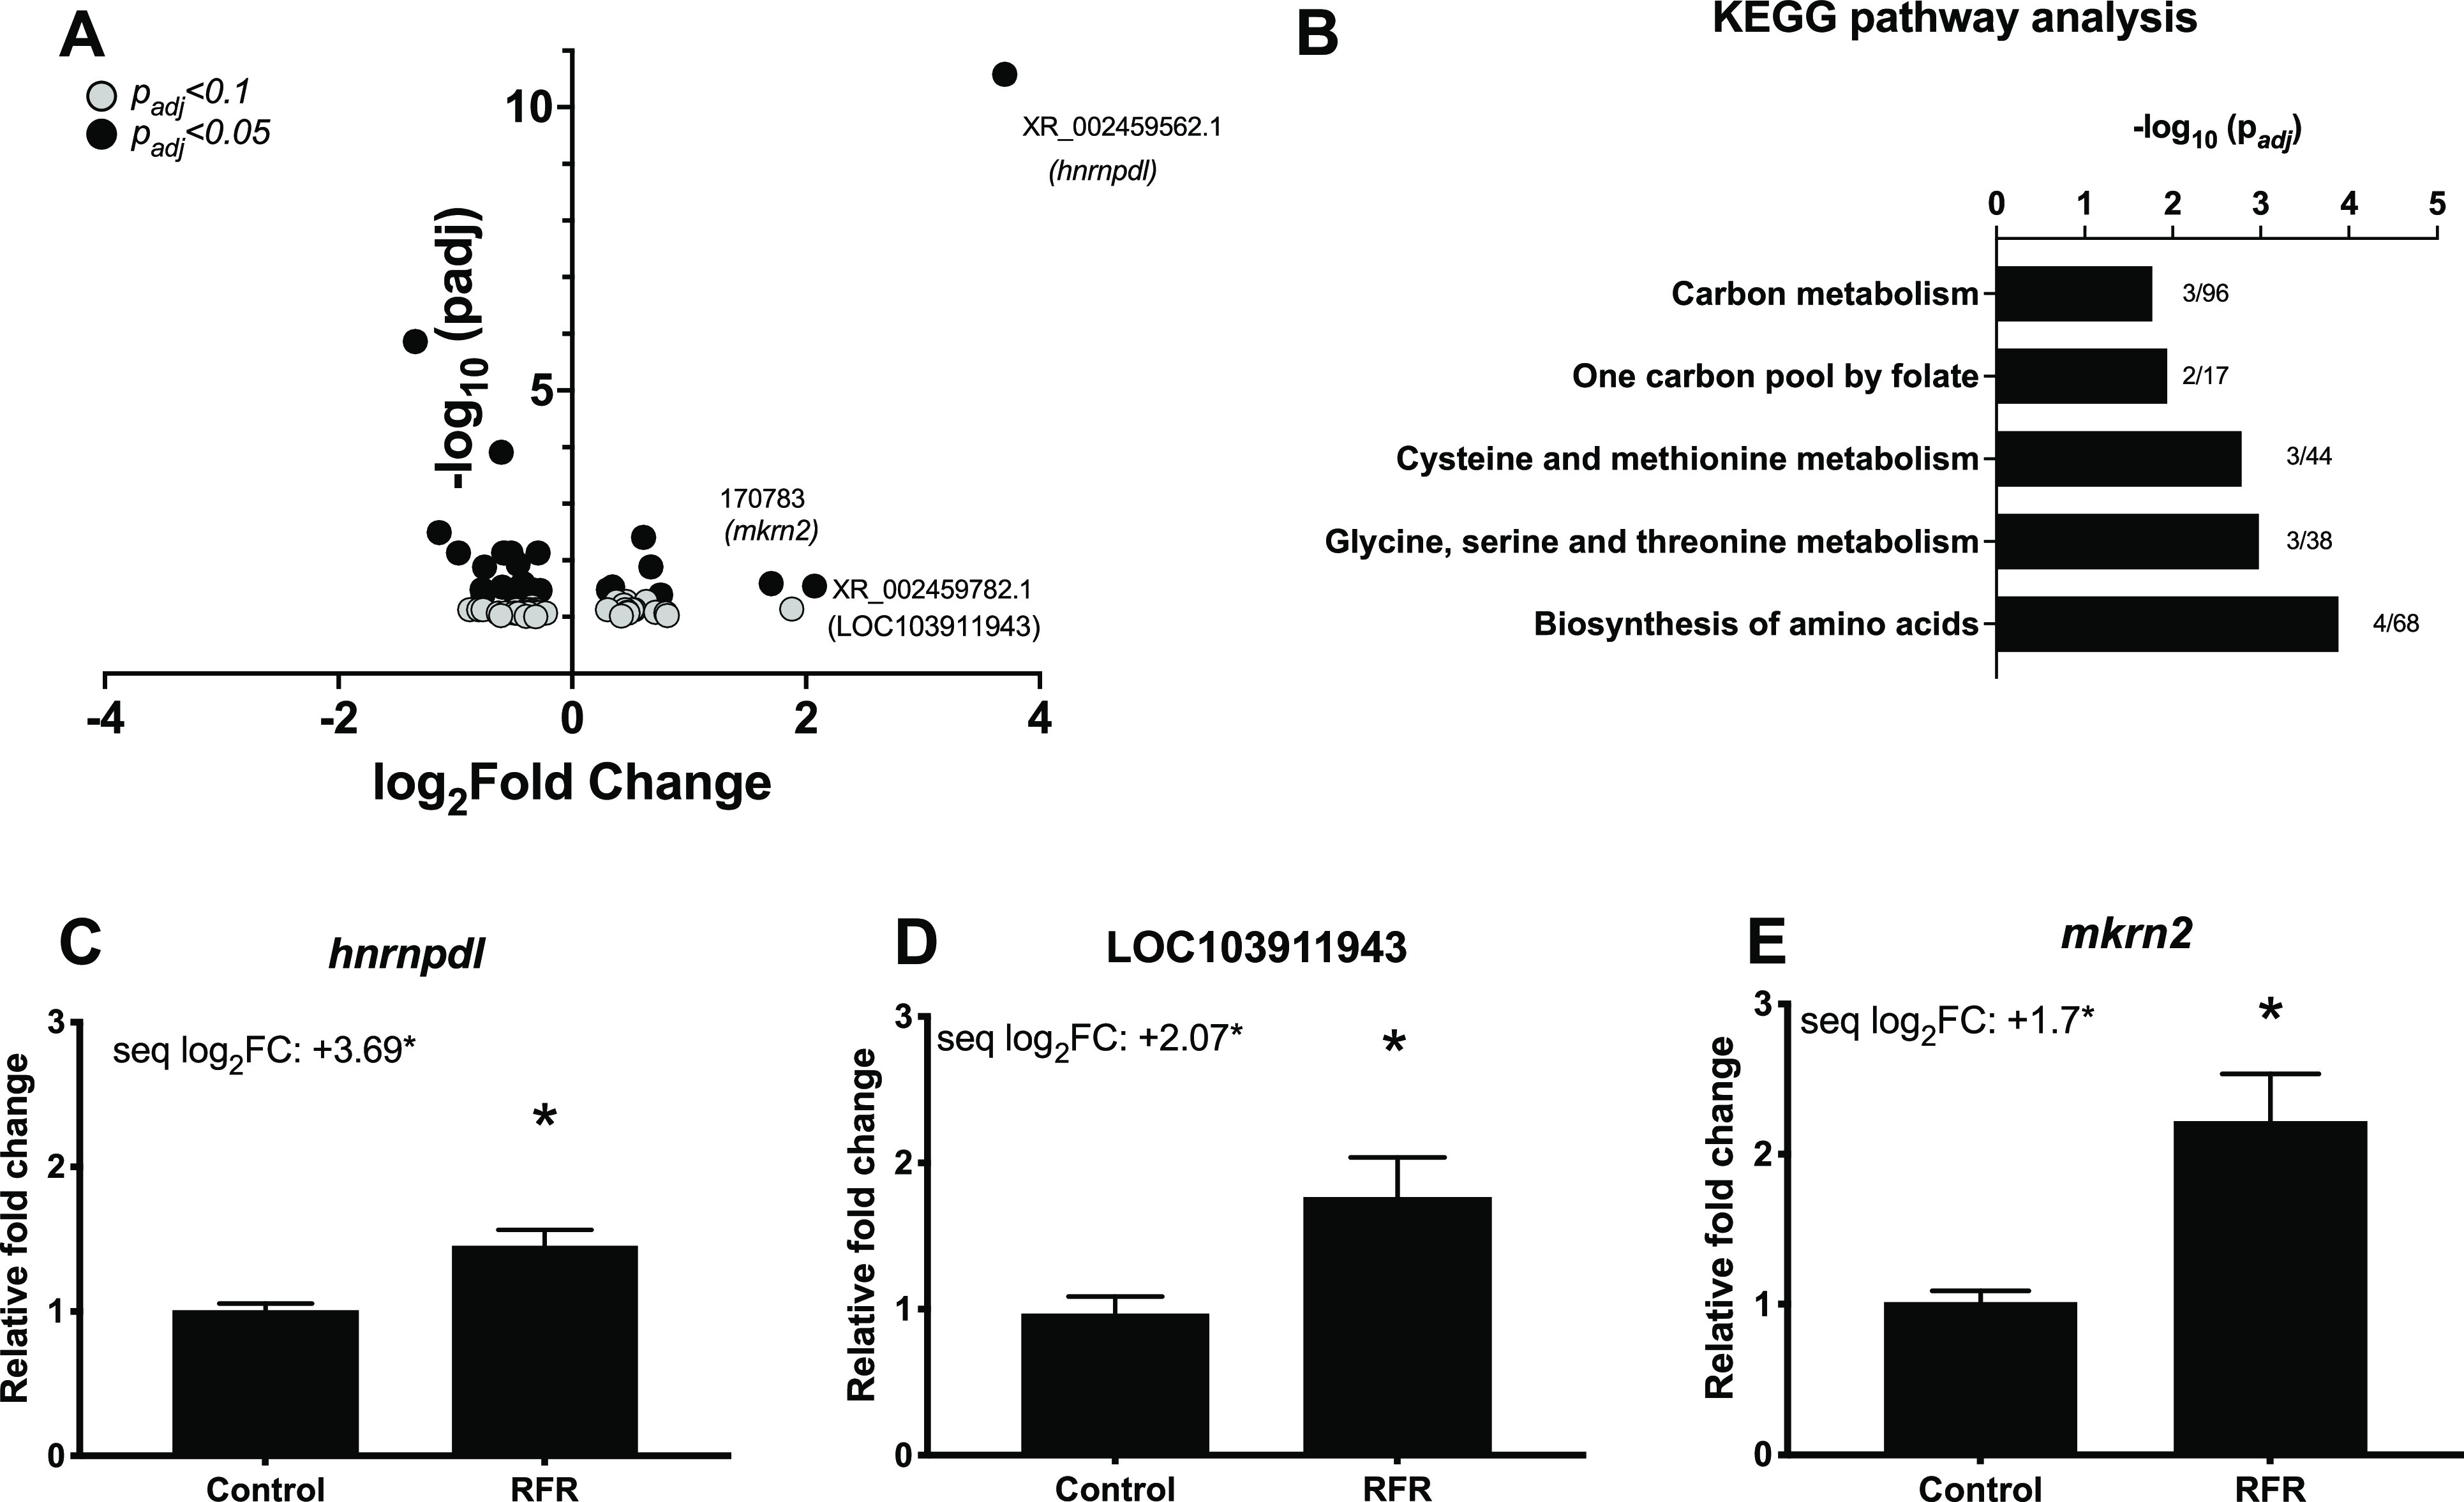
Transcriptomic effects of 3.5 GHz RFR exposures. Embryos were exposed to RFR from 6 to 48 hpf, followed by gene expression assessments. (A) Volcano plot showing differentially expressed genes with padj values of <0.1 and <0.05. (B) KEGG pathway analysis of differentially expressed mRNAs with padj values of <0.05. Numbers next to bars represent differentially expressed genes divided by the total number of genes in that pathway. (C–E) qPCR validation for the top three differentially expressed genes with padj values of <0.05. Data expressed as relative fold change ± the standard error of the mean. N = 6–8 biological replicates. An asterisk indicates a statistically significant difference using a t test (p < 0.05). “seq log2FC” indicates a log2-fold change from the mRNA sequencing data.
