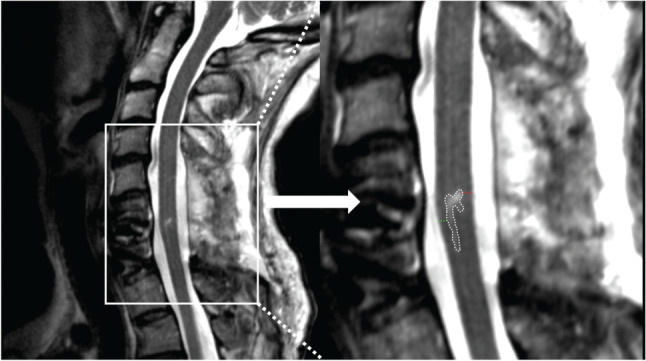
Figure 1.

A representative participant’s T2-weighted midsagittal magnetic resonance image, seen on the left panel and zoomed in on the right panel. The lesion hyperintensity is delineated in white, the measured width of ventral tissue bridge in green, and dorsal tissue bridge in red.
