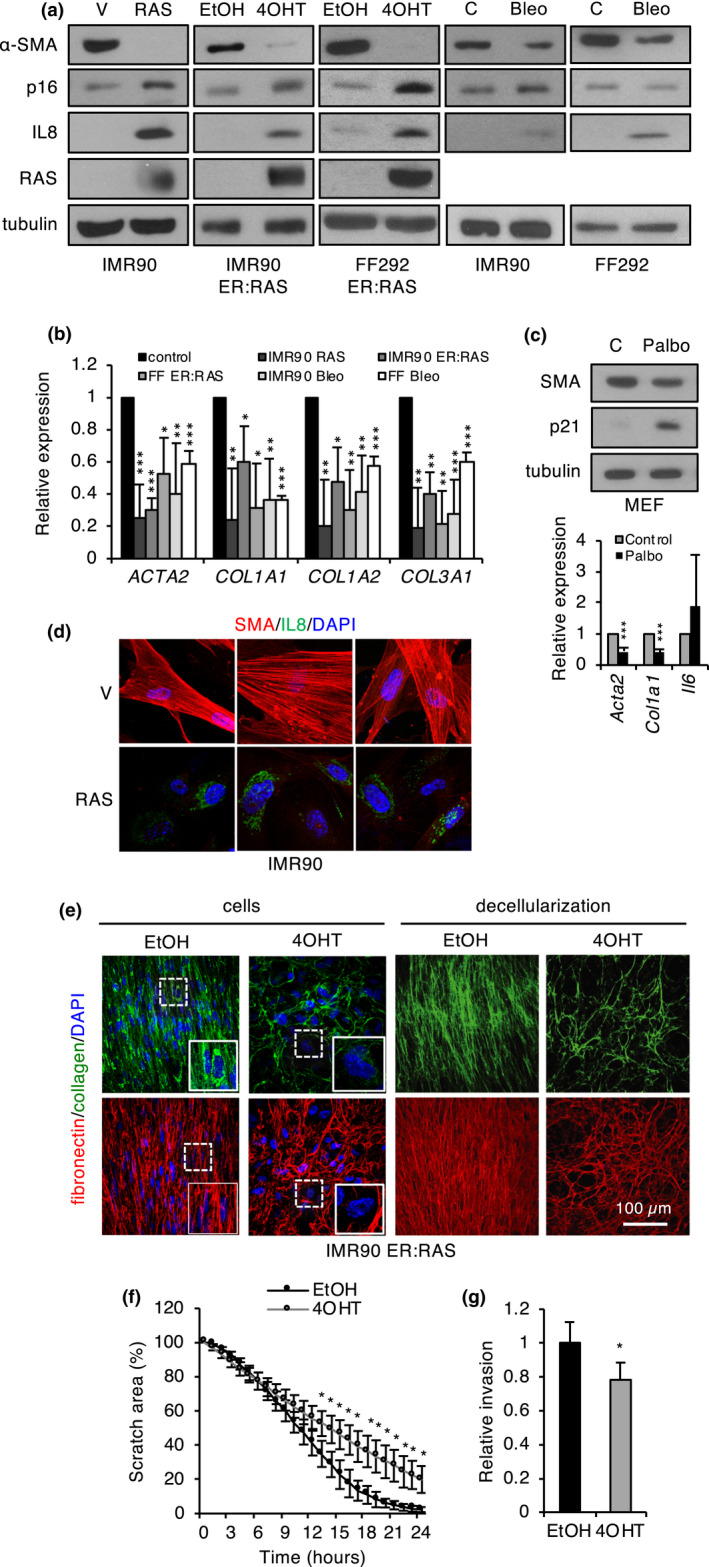
FIGURE 1.

Regulation of myofibroblast markers in senescence. (a) Western blot analysis of α‐SMA, p16, IL‐8, and RAS/ER:RAS in the indicated human fibroblast cellular models of senescence. Tubulin was used as a loading control. (b) qPCR analysis of myofibroblast and ECM markers in the indicated cellular senescence models. The mean and standard deviation from at least three independent experiments are shown. (c) Western blot (top panel) and qPCR analysis (bottom panel) of the indicated senescence (p21), SASP (IL‐6), and myofibroblast (Acta2, Col1a1) markers in MEFs made senescent with palbociclib. The mean and standard deviation from three independent experiments are shown. (d) Immunofluorescence of α‐SMA, and IL‐8 in RAS‐senescent and control (V) human fibroblasts. (e) Immunofluorescence of collagen I and fibronectin 1 in senescent (4‐OHT) and control (EtOH) FF292 ER:RAS fibroblasts before (cells) or after decellularization. DAPI was used as a nuclear staining control. (f) Wound healing assay with senescent (4‐OHT) and control (EtOH) FF292 ER:RAS fibroblasts. The graph shows the scratch area at the indicated time points after scratching. The mean and standard deviation from three independent experiments are shown. (g) Invasion assay with senescent (4‐OHT) and control (EtOH) FF292 ER:RAS fibroblasts. The number of cells in the bottom of the membrane relative to the number of cells seeded was counted for each condition and then relativized to control fibroblasts. The mean and standard deviation from four independent experiments are shown. Bleo, bleomycin; Palbo, palbociclib
