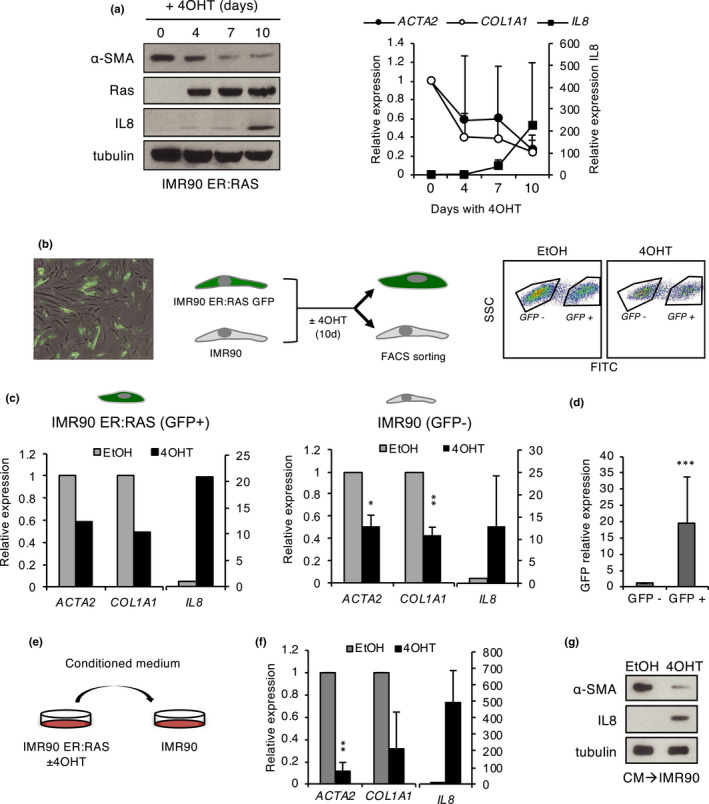
FIGURE 2.

Paracrine transmission of myofibroblast phenotype regulation during senescence. (a) Western blot (left) and qPCR (right) analysis of IL‐8 and the myofibroblast markers α‐SMA (ACTA2) and COL1A1 during senescence induction with 4‐OHT in IMR90 ER:RAS fibroblasts. (b) Left panel: Representative image of co‐culture of IMR90 ER:RAS GFP and IMR90 fibroblasts (overlay bright field and GFP fluorescence) before adding 4‐OHT. Middle panel: experimental design of co‐culture experiments. Right panel: Flow cytometry sorting of GFP‐positive and GFP‐negative populations in co‐cultures treated with 4‐OHT or EtOH for 10 days. (c) qPCR analysis of IL‐8 and myofibroblast markers in sorted GFP‐positive (IMR90 ER:RAS) and GFP‐negative (IMR90) populations. The mean and standard deviation from two independent experiments are shown for GFP‐negative cells; one representative experiment is shown for GFP‐positive cells. (d) qPCR of GFP in sorted GFP‐positive and GFP‐negative populations. (e) Experimental design of conditioned medium experiments. (f) qPCR analysis of IL‐8 and myofibroblast markers in IMR90 fibroblasts exposed to conditioned medium from control (EtOH) and senescent (4‐OHT) IMR90 ER:RAS fibroblasts. The mean and standard deviation from two independent experiments are shown. (g) Western blot analysis of α‐SMA and IL‐8 in the same cells as in F
