FIGURE 4.

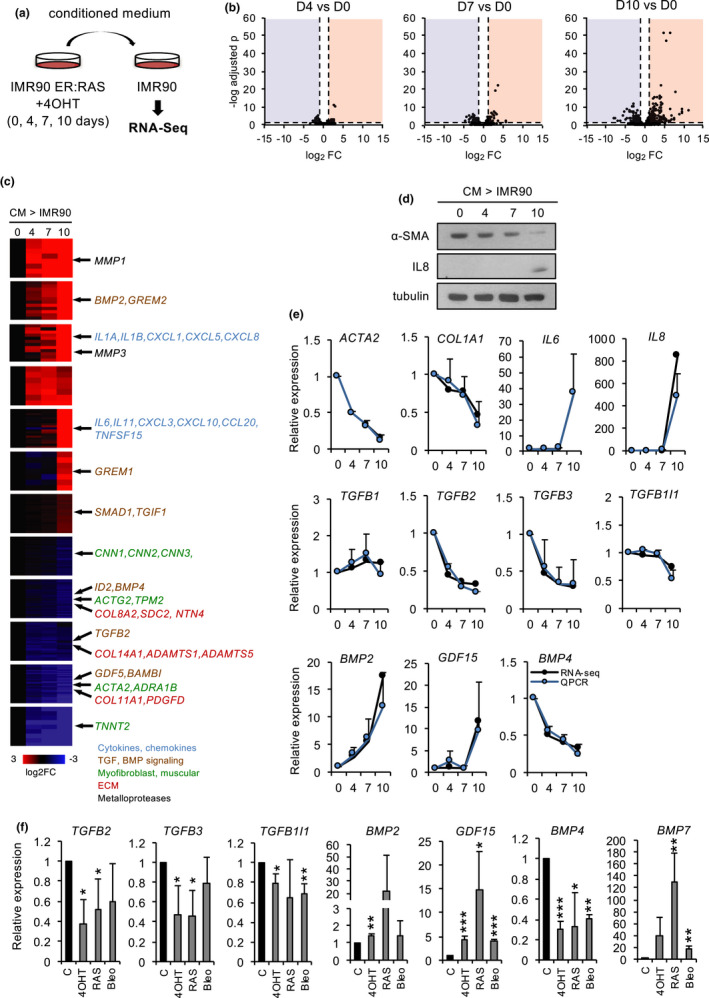
Transcriptomic dynamic analysis of paracrine senescence. (a) Experimental design. (b) Volcano plot of differential expression of D4, D7, and D10 cells relative to D0. The horizontal dashed line indicates p = 0.05, and the vertical dashed lines indicate fold change 2 or −2. (c) Expression clusters and representative genes. (d) Western blot of α‐SMA and IL‐8 in recipient fibroblasts along paracrine senescence kinetics. (e) Differential expression from RNA‐Seq and qPCR of the indicated genes in recipient fibroblasts along paracrine senescence kinetics. The mean and standard deviation from three independent experiments are shown for qPCR. (f) qPCR of the indicated genes in different forms of senescence in IMR90 fibroblasts. 4‐OHT: relative to EtOH control in ER:RAS cells; RAS, relative to vector‐infected cells; and Bleo, bleomycin‐treated cells relative to vehicle. The mean and standard deviation from three independent experiments are shown
